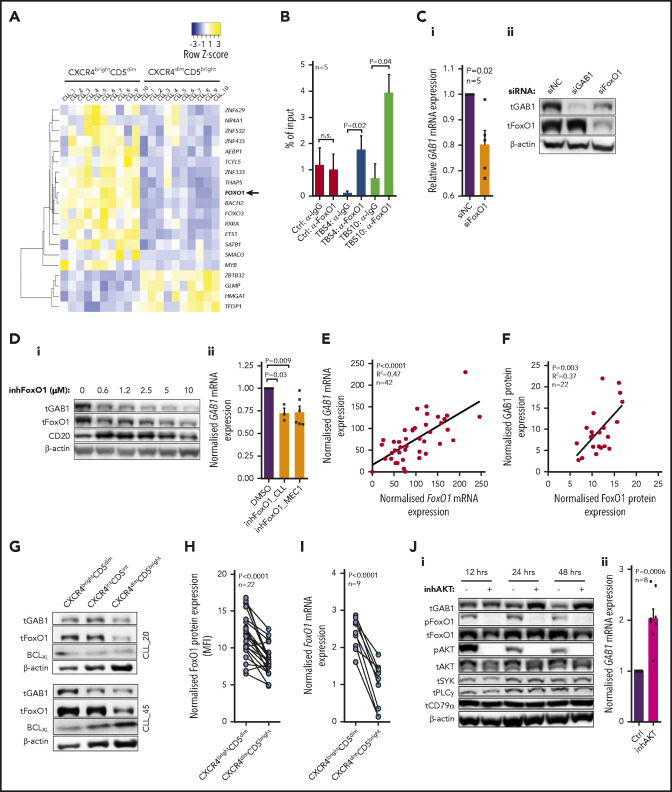
Figure 3.
FoxO1 serves as a transcriptional activator of GAB1. (A) Heat map of differentially expressed transcription factors (RNAseq; Illumina) in 10 primary CLL samples sorted according to CXCR4/CD5 expression (fold change, ≥2; P < .001). The list of all known human transcriptional factors was obtained from Lambert et al.48 (B) Chromatin immunoprecipitation analysis of FoxO1 binding upstream of the transcription start site of GAB1 gene (n = 5; binding sites are numbered as in supplemental Figure 14). The results for transcription binding sites (TBSs) 4 and 10 are represented as the DNA input percentage, and error bars indicate the standard error of the mean. Control samples (Ctrl, α-IgG; Ctrl, α-FoxO1) were analyzed by primers that amplified a region in the GAB1 second intron, which does not contain any predicted binding site for FoxO1. Data for other predicted TBSs were not analyzed or were inconclusive (supplemental Table 8). (Ci) The effect of siRNA against FoxO1 (siFoxO1) on GAB1 mRNA expression in MEC1 cells compared with cell transfection with a control scrambled siRNA (siNC; 48 hours after transfection, n = 5). (Cii) Representative immunoblot of FoxO1 silencing by siRNA (siFoxO1) and its impact on GAB1 protein level in MEC1 cells (48 hours). The siRNA against GAB1 (siGAB1) serves as a positive control and control scrambled siRNA (siNC) as a negative control. (Di) Representative immunoblot of GAB1 levels in primary CLL cells treated in vitro with various doses of FoxO1 inhibitor (inhFoxO1, 0.6-10 µM; 48 hours). CD20 induction was used as a positive control, because FoxO1 acts as a transcriptional repressor of CD20.54 (Dii) Statistical analysis of FoxO1 inhibitor’s effect (inhFoxO1; 1 µM) on GAB1 mRNA expression in primary CLL (n = 3; 48 hours) and MEC1 (n = 6; 48 hours) cells. GAB1 mRNA expression in each control sample (dimethyl sulfoxide [DMSO] treated) was set at 1. (E) GAB1 and FoxO1 mRNA expression correlation analysis in primary CLL cells (n = 42; real-time qPCR). (F) Correlation of GAB1 and FoxO1 intracellular protein levels assessed by flow cytometry (n = 22). (G) Representative immunoblot from intraclonal CLL cell subpopulations sorted according to CXCR4/CD5 expression (purity >99.9%). Subpopulation sorting was performed according to the gating strategy in Figure 1B. BCLXL levels served as a positive control for microenvironmental interactions. For other immunoblots and densitometric quantification, see supplemental Figure 6. (H) FoxO1 expression in CXCR4/CD5 subpopulations was assessed by intracellular staining (n = 22; flow cytometry). As a control, an identical CXCR4/CD5-stained sample was incubated with a secondary antibody only. (I) Validation of FoxO1 mRNA expression in primary CLL samples. CLL cells were sorted according to CXCR4/CD5 expression and analyzed by real-time qPCR (n = 9). (Ji) Representative immunoblot from MEC1 cells treated with a selective inhibitor of AKT (inhAKT; MK-2206, 2HCl; 1 µM) or vehicle (DMSO). The primary antibody against pFoxO1 detected phosphorylation on S256, which led to inhibition of FoxO1 activity. (Jii) GAB1 mRNA expression in MEC1 cells treated with a selective AKT inhibitor (as in Ji) for 24 hours (n = 8).

