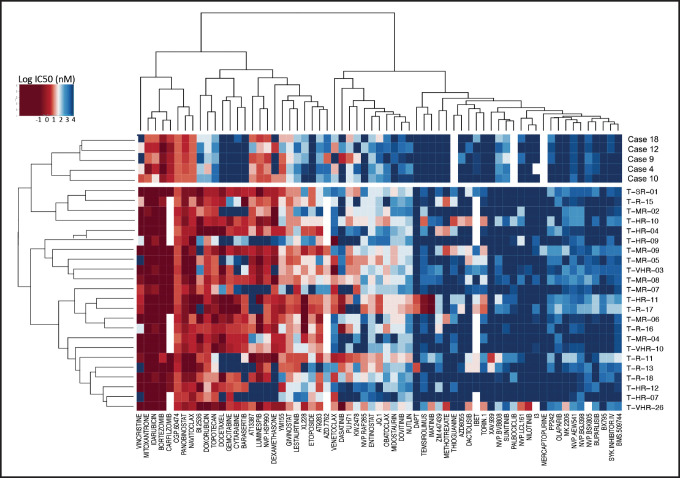
Figure 5.
Drug response profile of BCL11B-a AL. Heat map indicating the response of BCL11B-a AL (5 cases: 4, 9, 10, 12, and 18) compared with T-ALL (23 cases)17 to 65 compounds and represented by 50% inhibitory concentration values (IC50). Samples (rows) are in order according to clinical classification (BCL11B-a AL and T-ALL), and compounds are reported in columns.

