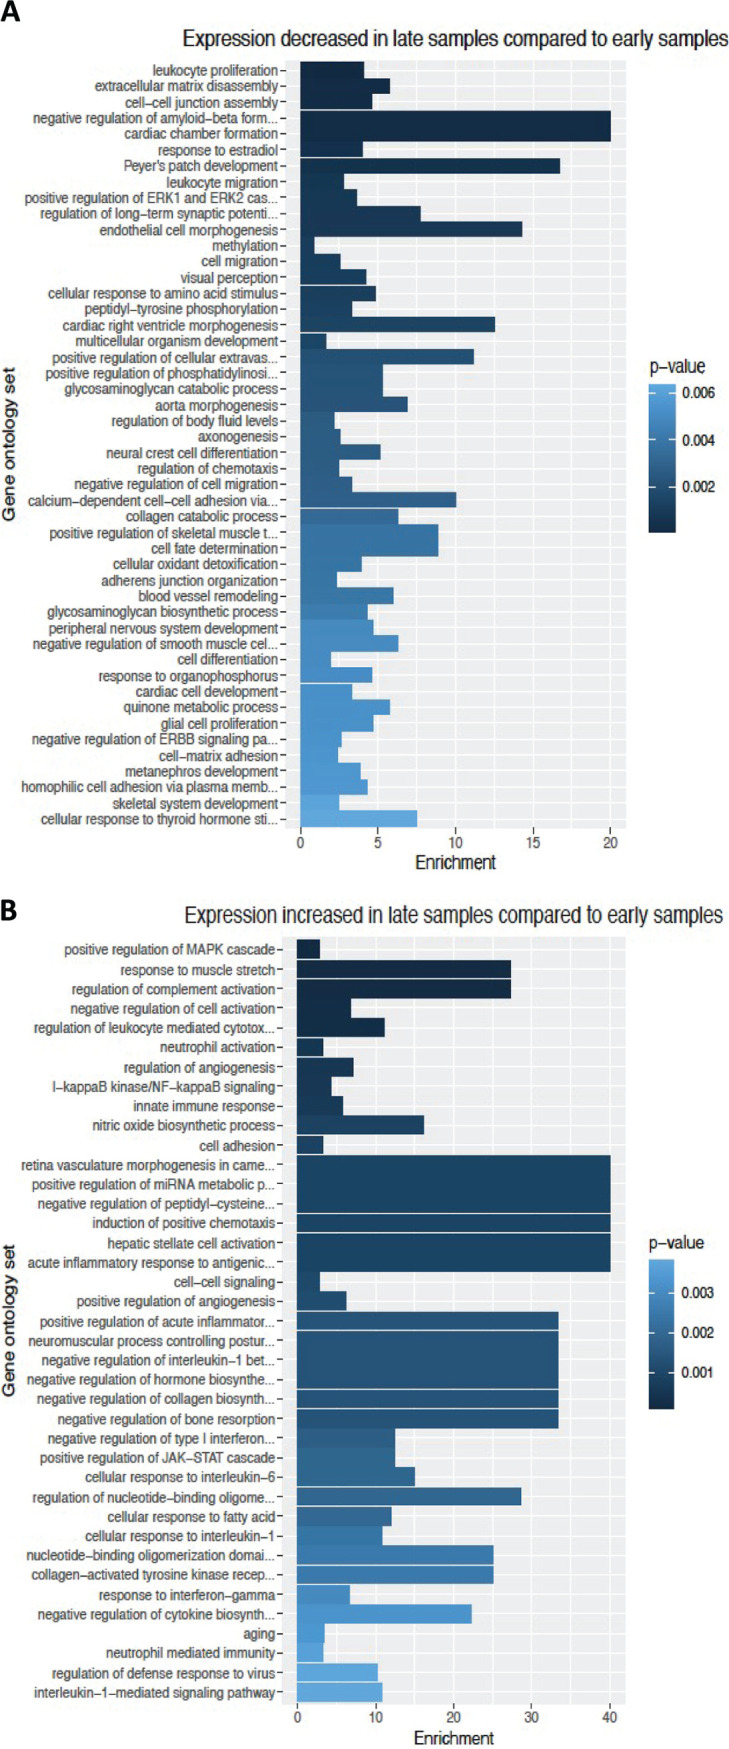
FIG 2.

Differentially regulated gene ontology by late compared to early stool samples. The bar graphs show the degree of enrichment by gene ontology from epithelial cells exposed to the late stool samples in comparison to the exposure to the early stool samples. The differences increase from bottom to top. Immune system, development, and cell-cell adhesion genes are differentially regulated likely by changes in microbiome mass and composition. (A) Categories of genes that are downregulated in the late samples relative to the early samples. (B) Categories of genes that are upregulated in the late samples relative to the early samples. The names of the gene ontology groups are shown on the y axis, and the enrichment score is shown on the x axis. The shaded color of the bars indicates the P value for the significance test of enrichment. The statistics and GO accession numbers are included in Table S1 in the supplemental material.
