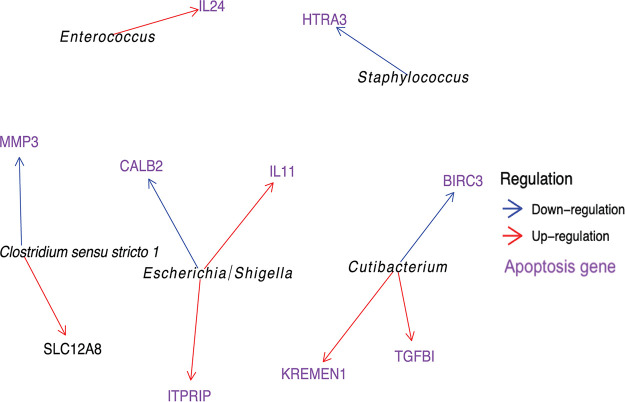
FIG 3.
Network graph of genus-gene interactions. The network graph shows the associations between bacterial genera from stool samples and gene expression from epithelial cells. The genera are in italics. Arrows point to genes, and the arrows indicate if the relationship is one of downregulation (blue) or upregulation (red). Genes that have been linked to apoptosis in the literature are in purple.

