Fig. 3.

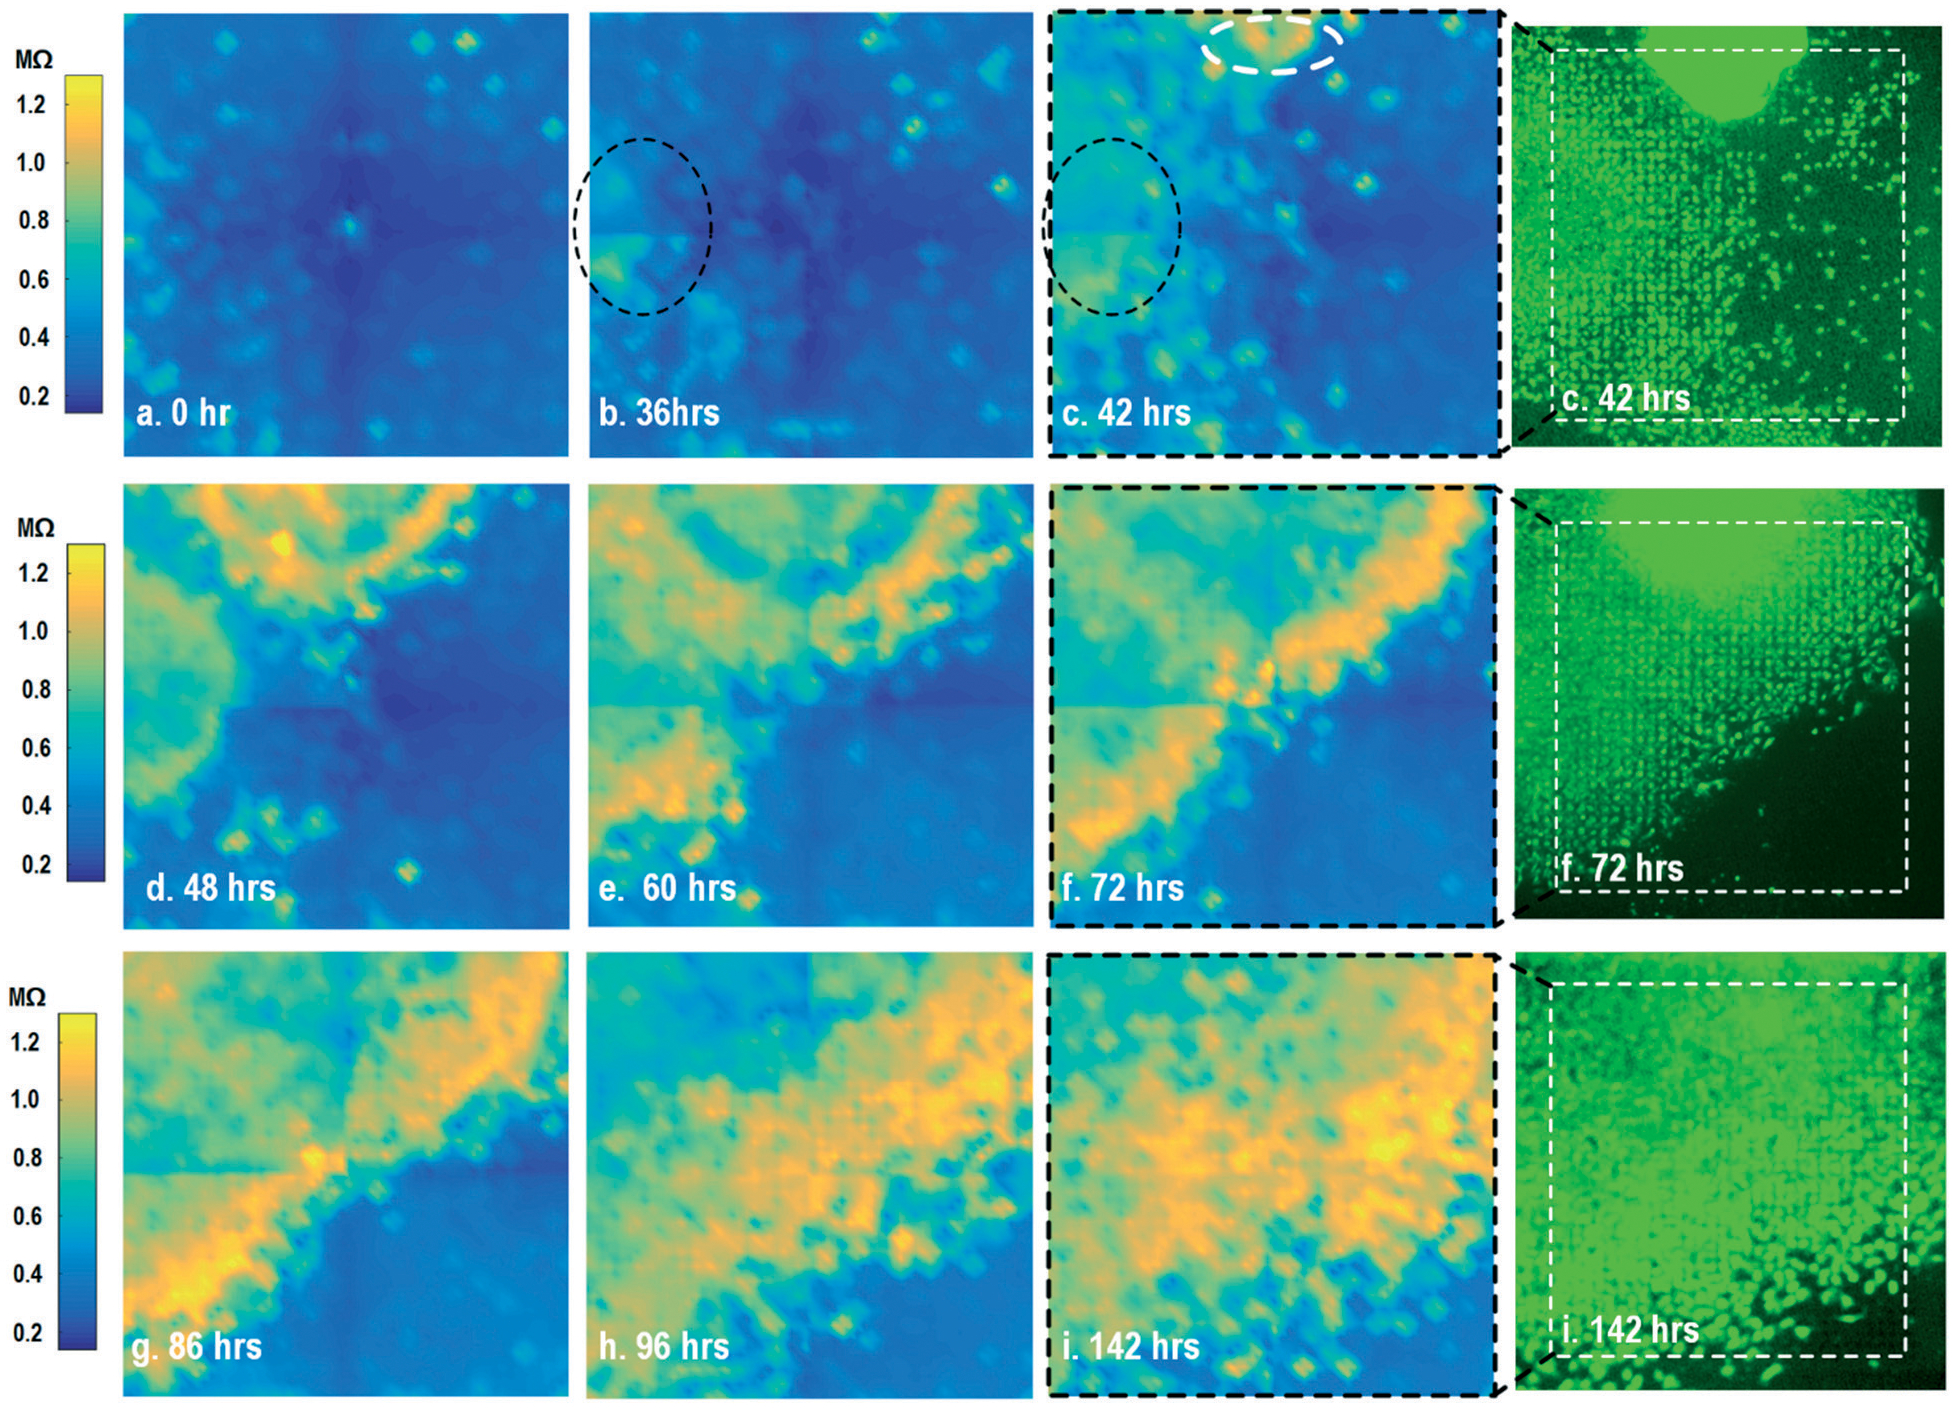
Measured time-lapse cellular impedance images of on-chip cultured fibroblasts together with reference fluorescence images. The cellular impedance measurement is performed at 100 kHz and the impedance magnitude is plotted.

Measured time-lapse cellular impedance images of on-chip cultured fibroblasts together with reference fluorescence images. The cellular impedance measurement is performed at 100 kHz and the impedance magnitude is plotted.