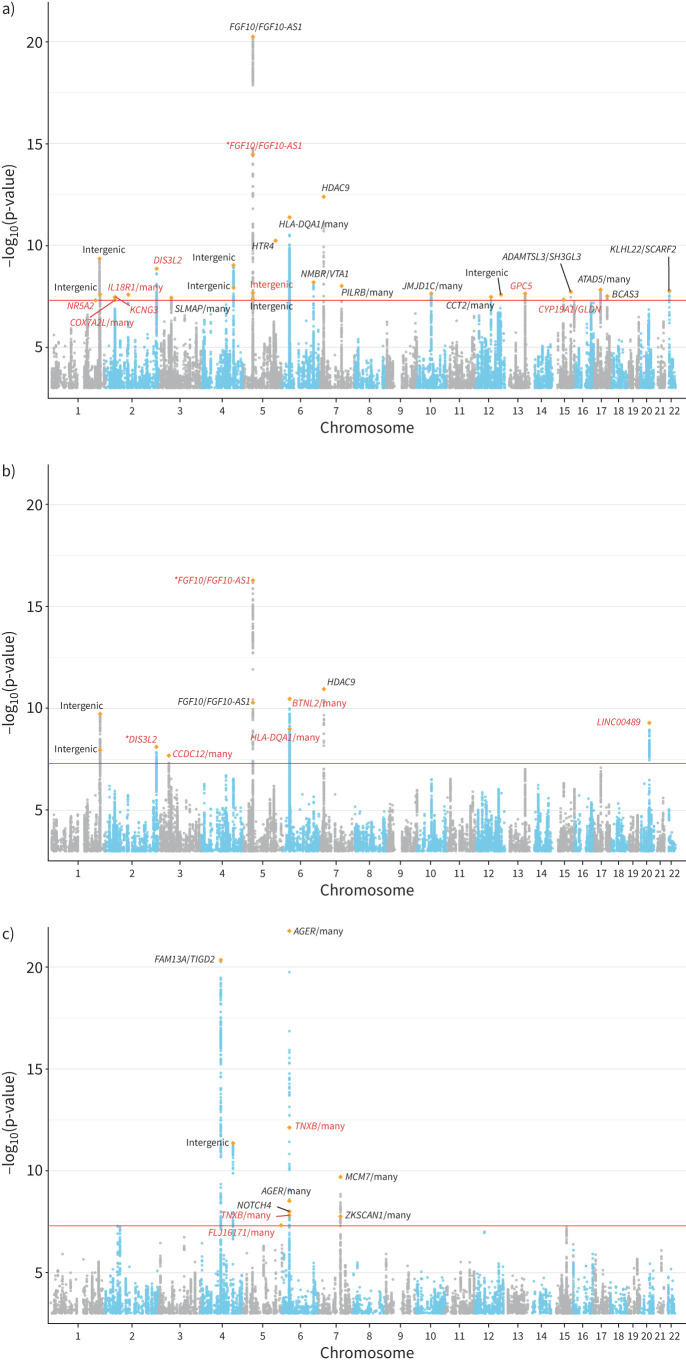
FIGURE 2.
Manhattan plots for genome-wide association analysis of 100 285 Chinese subjects in the China Kadoorie Biobank cohort for three lung function traits: a) forced expiratory volume in 1 s (FEV1), b) forced vital capacity (FVC) and c) FEV1/FVC. The x-axis denotes the genomic position (chromosomes 1–22); the y-axis denotes the –log10(p-value) of association test and starts at –log10(p-value)=3. The most significant novel variant in each independent clump is highlighted by an orange diamond symbol. Genes in black were previously reported and genes in red are novel. An asterisk on some genes indicates a novel variant. The genome-wide significance level (p=5×10⁻⁸) is denoted by the red line.

