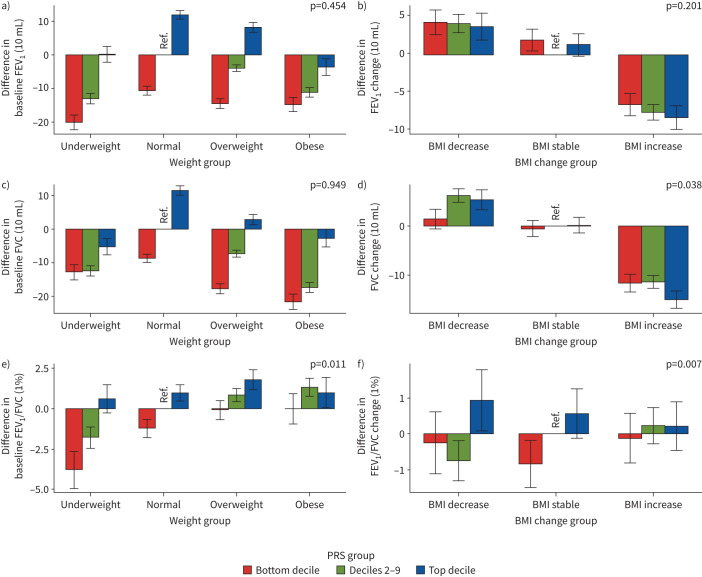
FIGURE 4.
Relationship of the distribution of three lung function polygenic risk scores (PRSs) with body mass index (BMI) in the China Kadoorie Biobank for a, c, e) the baseline model and b, d, f) the change model: a, b) forced expiratory volume in 1 s (FEV1), c, d) forced vital capacity (FVC) and e, f) FEV1/FVC. For the baseline model, we set normal BMI and the deciles 2–9 group as reference; for the change model, we set BMI stable and the deciles 2–9 group as reference. For the baseline model, the x-axis denotes different BMI categories by the following definitions: underweight BMI <18.5 kg·m−2, normal BMI 18.5–24.9 kg·m−2, overweight BMI 25.0–29.9 kg·m−2 and obese BMI ≥30.0 kg·m−2. The y-axis denotes the difference between lung function measurements for each group and the reference group. For the change model, the x-axis denotes different BMI change categories: BMI decrease is defined as BMIt1−BMIt0≤ −1 kg·m−2, BMI stable is defined as −1 kg·m−2<BMIt1−BMIt0≤1 kg·m−2 and BMI increase is defined as BMIt1−BMIt0>1 kg·m−2. The y-axis denotes the difference between lung function measurements change (lung functiont1−lung functiont0) for each group and the reference group. The PRS groups were defined as: bottom decile, deciles 2–9 and top decile. The p-value on each plot represents the lung function and baseline BMI or BMI change interaction p-value from baseline or change models.

