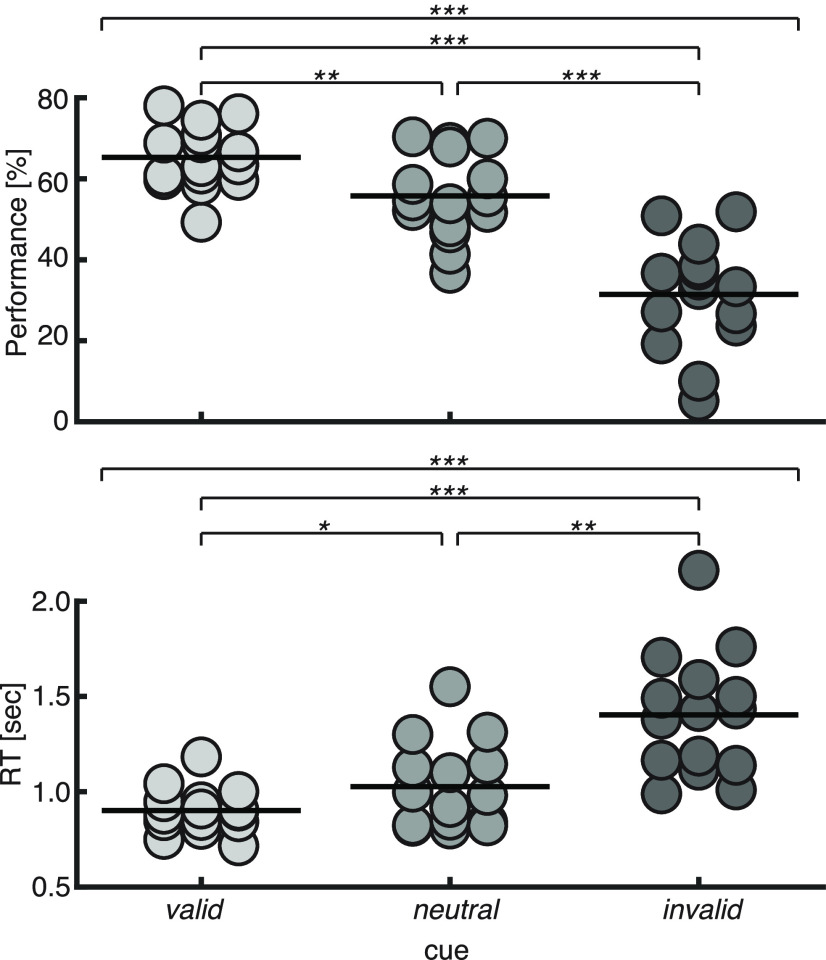
Figure 2.
Behavioral results. Dots represent single-subject data (percentage correct and trial-averaged correct RT in top and bottom panels, respectively). Horizontal thick lines represent the group mean. The top thin horizontal line in each panel represents the result of a repeated-measures ANOVA, and the other thin horizontal lines represent pairwise comparisons: *p < 0.05, **p < 0.01, ***p < 0.001.

