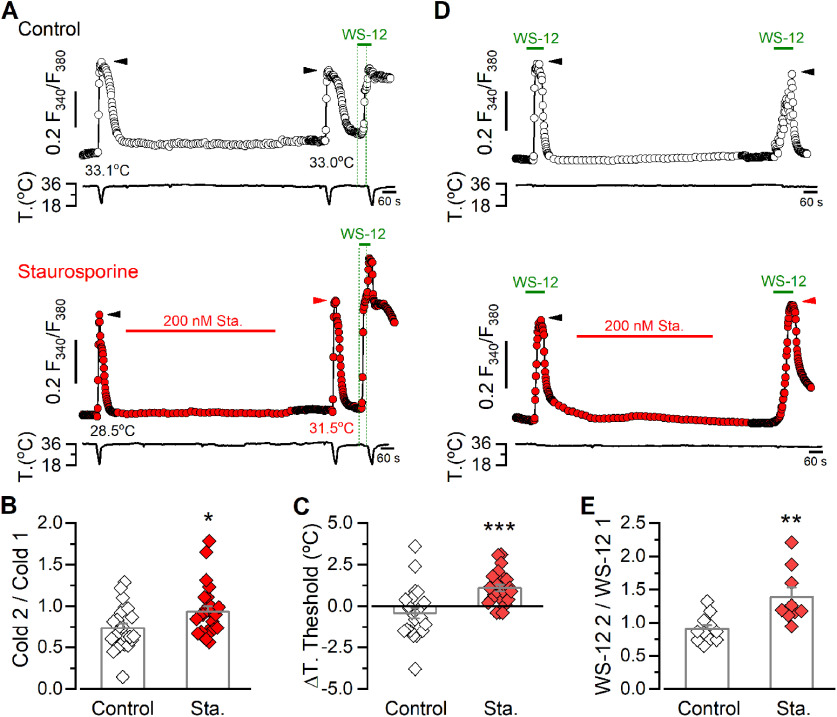
Figure 10.
Kinase inhibition potentiates cold- and WS-12-evoked responses in trigeminal cold thermoreceptors. A, Fura-2 ratiometric imaging of [Ca2+]i responses to consecutive cooling ramps in TG CSNs, recorded simultaneously with the temperature of the bath. Traces are representative of a control experiment (top) and a CSN perfused with 200 nm staurosporine for 10 min (bottom). A 1 μm WS-12 stimulus followed by a cooling ramp in the presence of the TRPM8 activator was also applied to assess the expression of the channel in both cases. Green dotted lines indicate the start of the WS-12 application and of the third cold stimulus. Black and red arrows on the [Ca2+]i traces indicate the maximal responses in each condition. Thermal thresholds of the neurons in response to the cold pulses are also indicated. B, Bar graph and data points of the ratio of cold-evoked responses (Cold 1/Cold 2) in control and in CTNs treated with the kinase inhibitor. Statistical significance was assessed with a two-tailed unpaired Student's t test (t(45) = 2.364, p = 0.0224; Control, n = 23, Sta., n = 24). C, Bar graph and data points represent the shift in the temperature threshold during the second cooling stimulus (T. threshold 2, T. threshold 1). Negative values indicate shifts toward lower temperatures. Statistical significance was assessed with a two-tailed unpaired Student's t test with Welch's correction (t(37) = 3.956, p = 0.0003; Control, n = 23, Sta., n = 24). Thermal thresholds in response to the first cold pulse were 29.8 ± 0.7°C in the control group (n = 23) and 30.0 ± 0.6°C in neurons that were treated with staurosporine (n = 24) (t(45) = 0.2815, p = 0.8280, unpaired t test). The maximal response (ΔRatio F340/F380) evoked by the first cold pulse was 0.322 ± 0.04 (n = 23) and 0.318 ± 0.03 (n = 24) in both groups, respectively (t(45) = 0.0877, p = 0.9305, unpaired t test). D, Representative ratiometric [Ca2+]i traces in TG CSNs, recorded simultaneously with the temperature of the bath, showing the response to two consecutive 0.5 μm WS-12 stimuli in control condition (top) and including a 10 min staurosporine treatment (bottom) in trigeminal neurons. Black and red arrows on the [Ca2+]i traces indicate the maximal responses in each condition. E, Bar graph and data points represent the WS-12 ratio response (WS-12 2/WS-12 1) to 0.5 μm WS-12 stimuli, in control condition and with kinase inhibition treatment. Statistical significance was assessed with a two-tailed unpaired Student's t test with Welch's correction (t(11) = 3.226, p = 0.0081; Control, n = 11, Sta., n = 9). The maximal response (ΔRatio F340/F380) to the first application of WS-12 was 0.180 ± 0.04 (n = 11) and 0.249 ± 0.05 (n = 9) in both groups, respectively (t(18) = 1.105, p = 0.2837, unpaired t test). Data in the bar graphs are mean ± SE. Statistical significance was assessed with two-tailed unpaired t test in all cases: *p < 0.05; **p < 0.01; ***p < 0.001).

