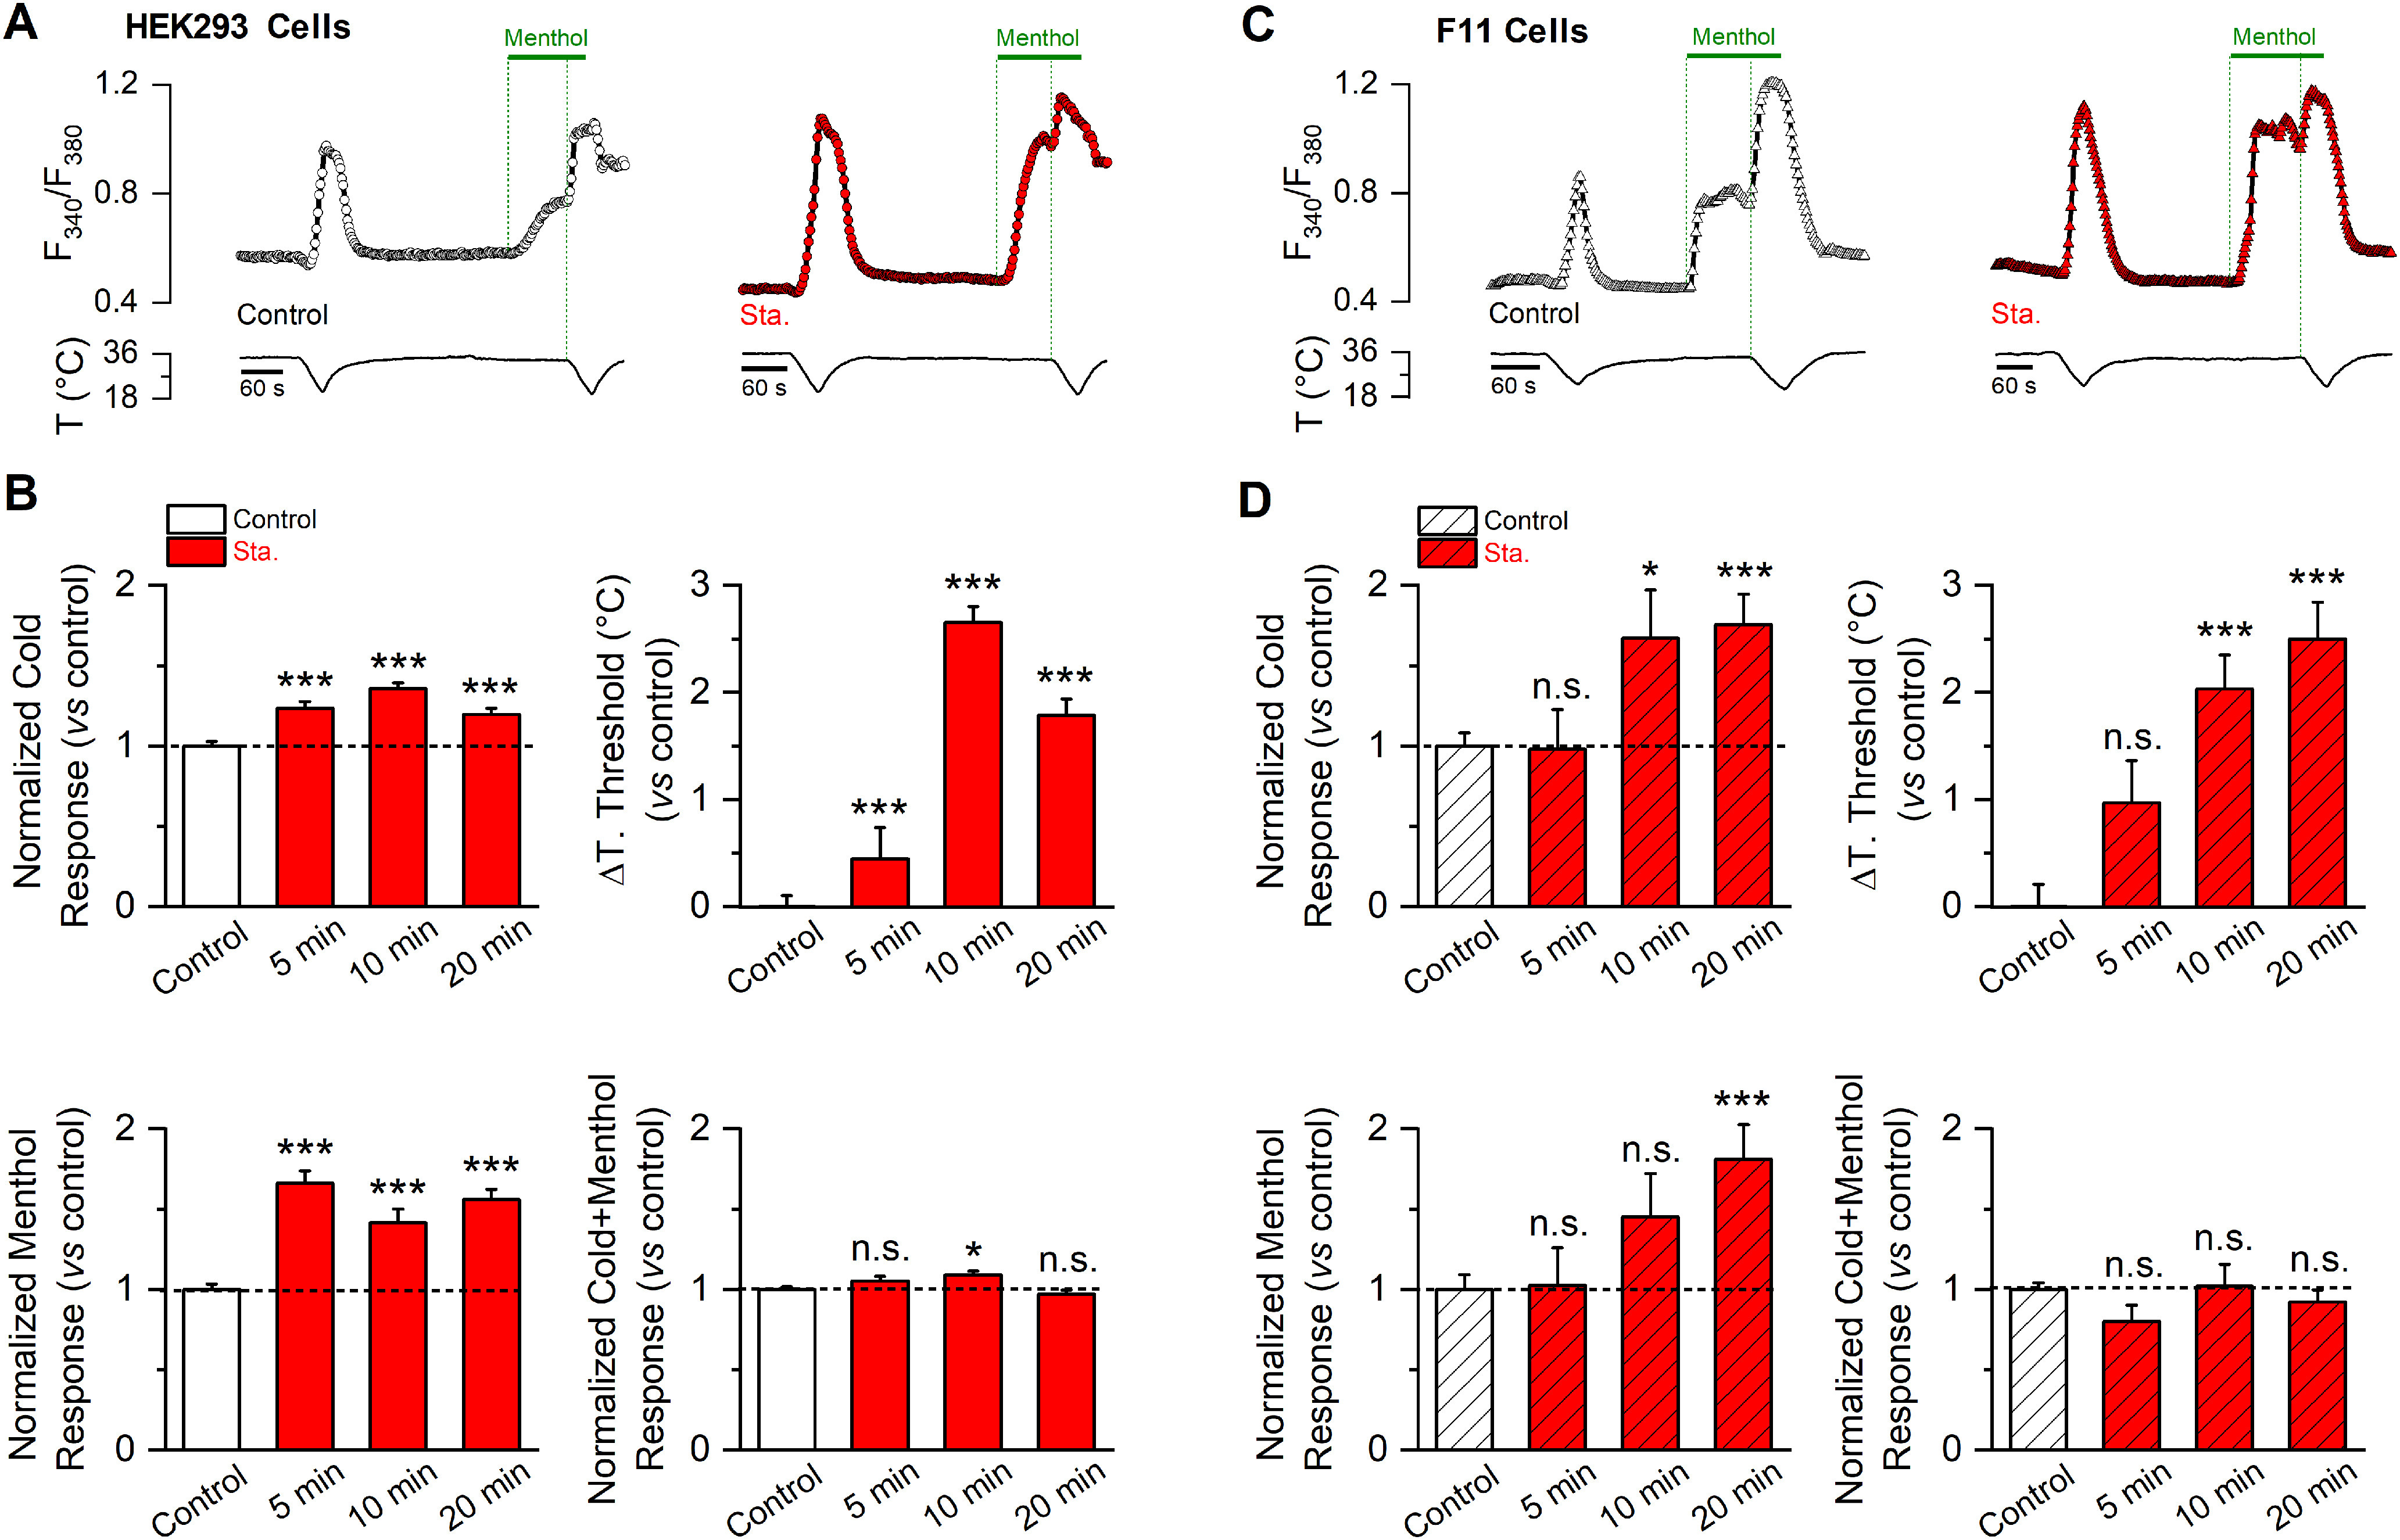
Figure 2.

Basal kinase activity downregulates TRPM8 channel function. A, Time course of [Ca2+]i (F340/F380) responses to cold, 100 μm menthol, and to a combined stimulus of cold in the presence of 100 μm menthol of HEK293-mTRPM8-myc cells, in control conditions (open circles) and after a 10 min preincubation with staurosporine 200 nm (red circles). B, Mean and SEM amplitude of cold-, menthol-, and Cold+menthol-induced responses in HEK293-mTRPM8-myc cells in control conditions and after 5, 10, and 20 min preincubation with 200 nm staurosporine (Sta.). The values were normalized to the mean response observed in control conditions in parallel experiments (Ctrl., n = 230; 5 min Sta., n = 95; 10 min Sta., n = 89; 20 min Sta., n = 92). Mean shift in temperature threshold (ΔT. threshold) displayed by staurosporine treatment is expressed according to the control values. Positive values indicate shifts toward warmer temperatures. Statistical analysis was performed using one-way ANOVA test (cold: F(3,502) = 21.00, p < 0.0001, ΔTo. threshold: F(3,502) = 62.67, p < 0.0001; menthol: F(3,502) = 48.63, p < 0.0001; Cold+menthol: F(3,502) = 4.69, p = 0.0031) in Dunnett's post hoc test: *p < 0.05; **p < 0.01; ***p < 0.001; ns, p > 0.05, compared with the control. C, Time course of [Ca2+]i (F340/F380) responses in F11 cells expressing mTRPM8-YFP channels, using the same protocol as in A. D, Mean and SEM amplitude of cold-, menthol-, and Cold+menthol-induced responses of TRPM8 in control conditions and after 5, 10, and 20 min preincubation with staurosporine 200 nm (Sta.). The values were normalized to the mean response observed in control conditions in parallel experiments (Control, n = 88; 5 min Sta., n = 24; 10 min Sta., n = 24; 20 min Sta., n = 35). Mean shift in temperature threshold displayed by staurosporine treatment is expressed according to the control values. Positive values indicate shifts toward warmer temperatures. Statistical analysis was performed using the one-way ANOVA test (cold: F(3,167) = 6.46, p = 0.0004, ΔT. threshold: F(3,167) = 17.30, p < 0.0001; menthol: F(3,167) = 5.47, p = 0.0013; Cold+menthol: F(3,167) = 1.32, p = 0.2689) in combination with a Dunnett's post hoc test: ns, p > 0.05; *p < 0.05; **p < 0.01; ***p < 0.001, compared with the control.
