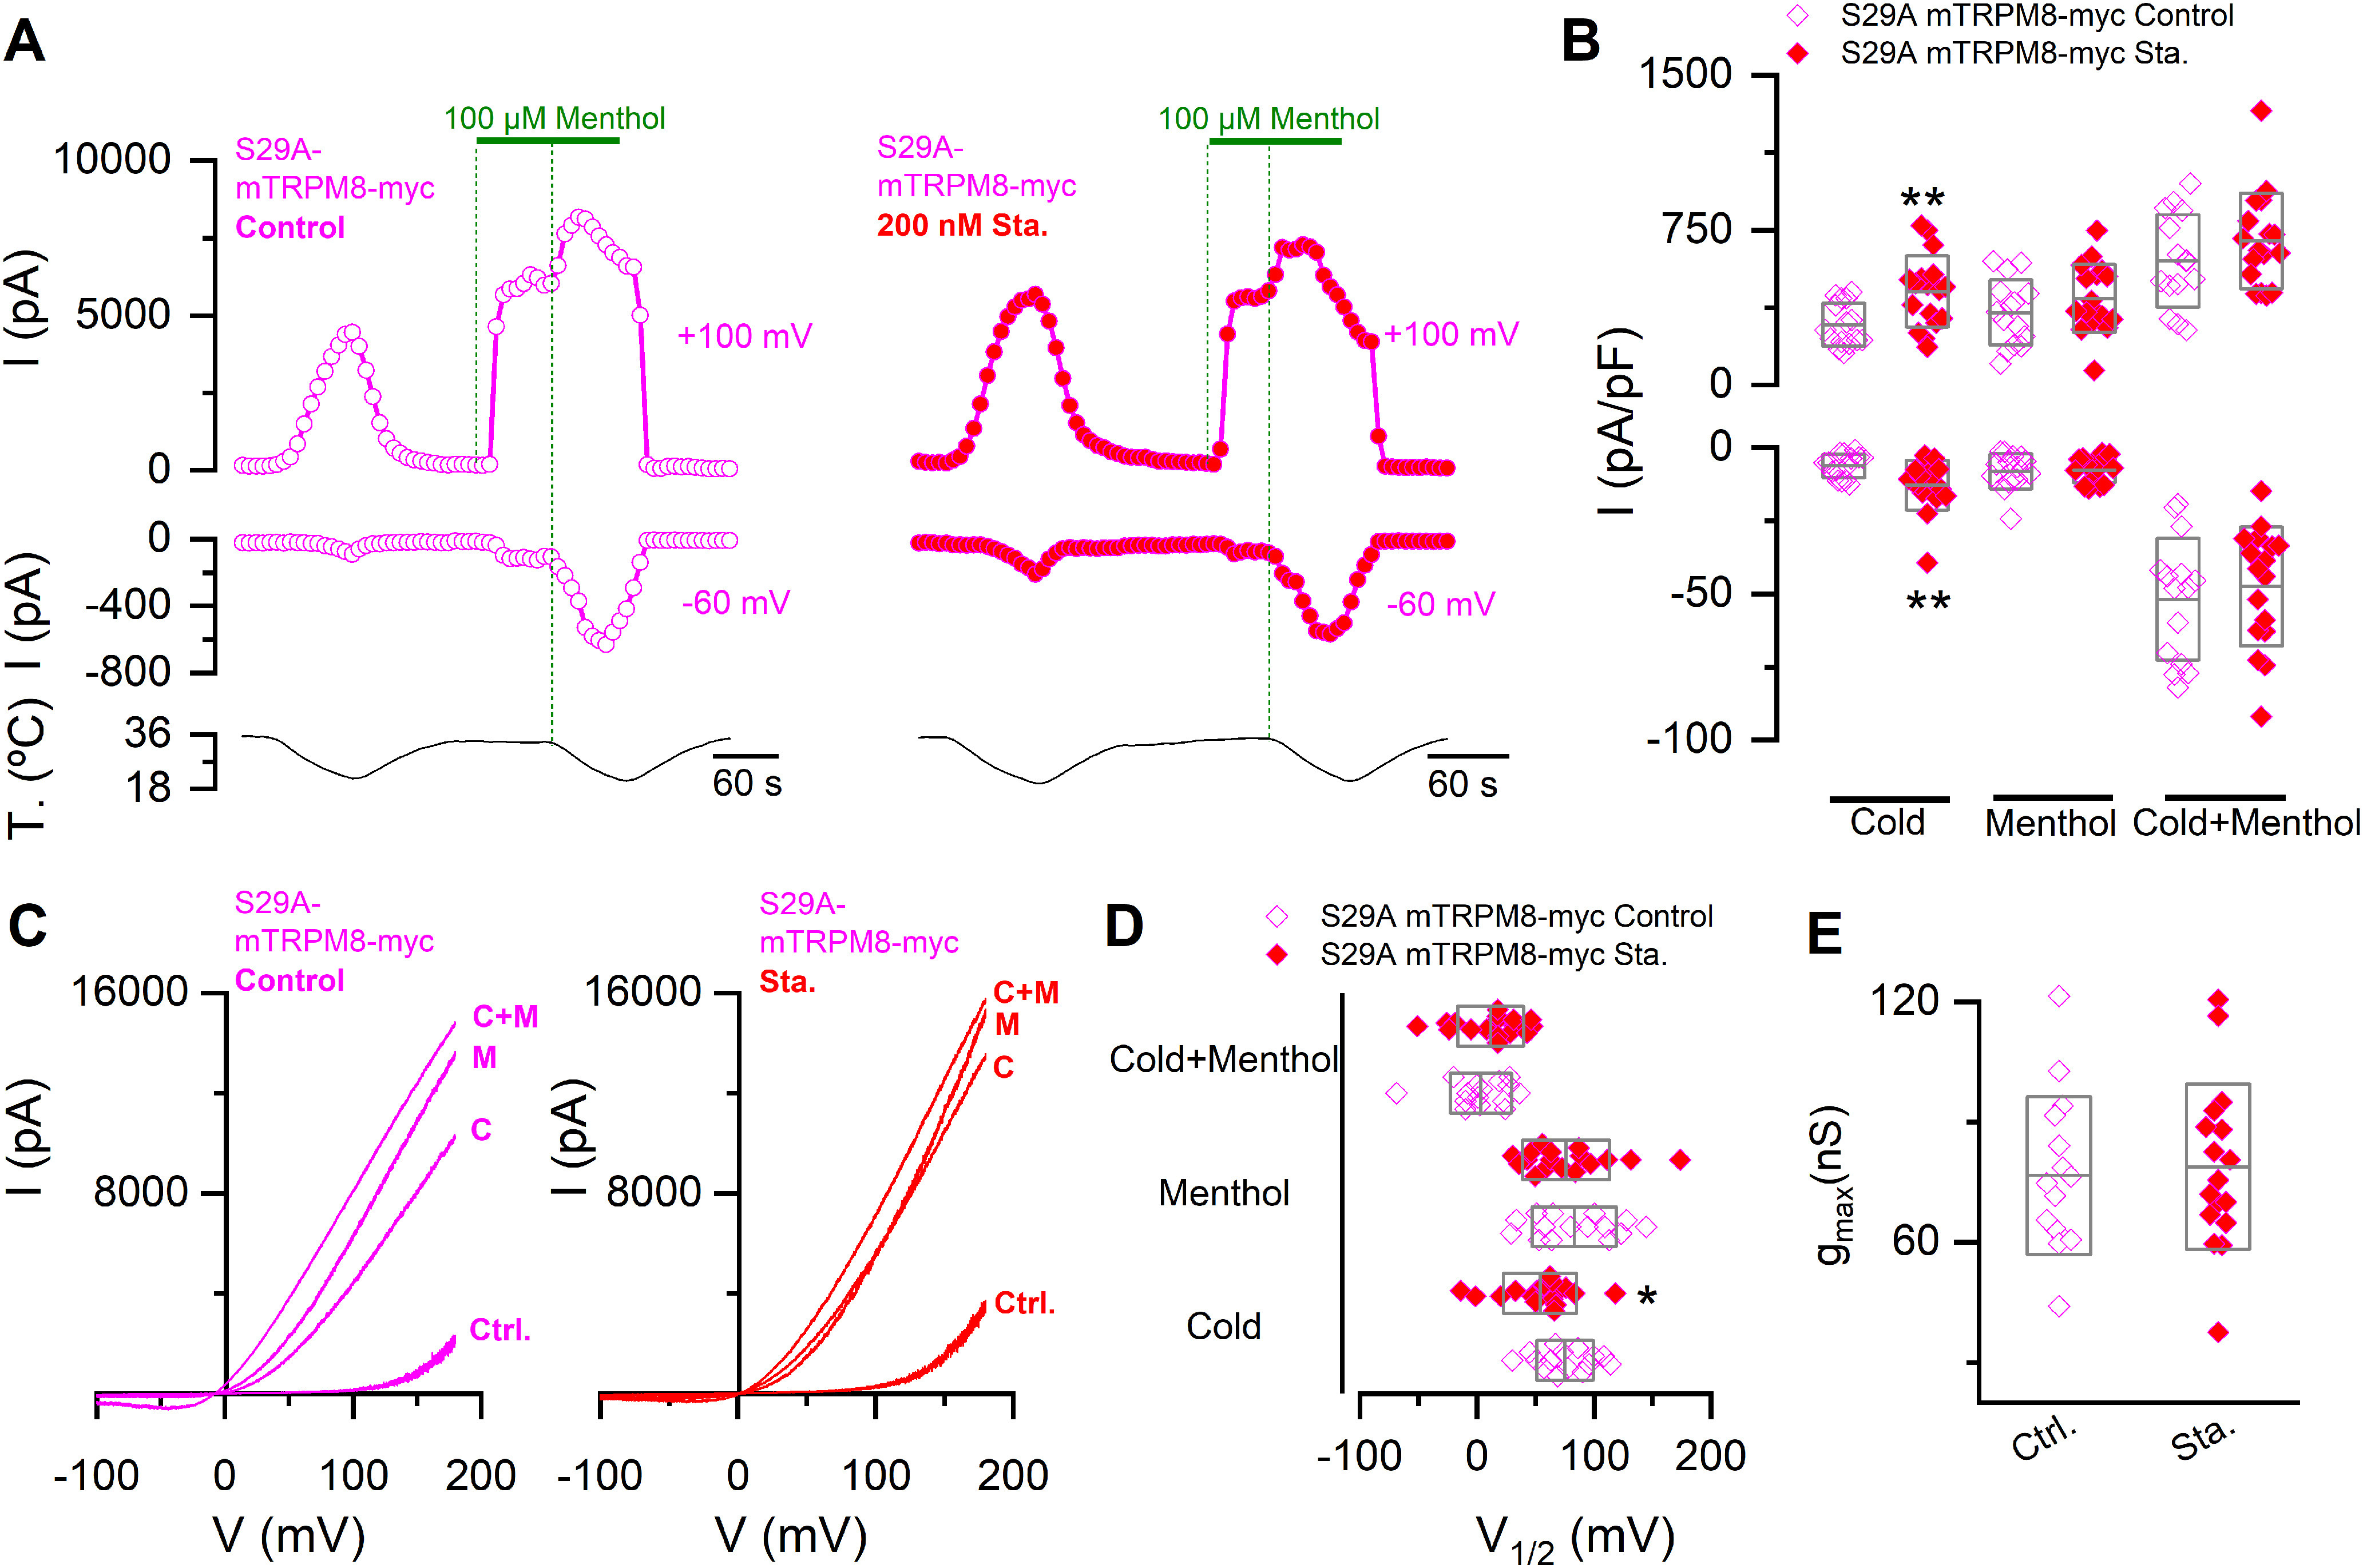
Figure 7.

The S29A mutant shows reduced sensitivity to kinase inhibition. A, Representative recordings of whole-cell currents measured at 100 and −60 mV in HEK293 cells transfected with S29A mTRPM8-myc mutant in control condition (open magenta circles) or preincubated for 10-15 min with 200 nm staurosporine (red magenta circles). B, Scatter plots with mean and SD of maximal current density at 100 and −60 mV. Statistical significance was assessed with a two-tailed unpaired Student's t test with Welch's correction (Cold100mV: t(26) = 3.21, p = 0.0035; Menthol100mV: t(29) = 1.18, p = 0.2470; Cold+menthol100mV: t(29) = 1.19, p = 0.2419; Cold-60mV: t(23) = 2.86, p = 0.0088; Menthol-60mV: t(24) = 0.19, p = 0.8469; Cold+menthol-60mV: t(29) = 0.60, p = 0.5506). C, I–V relationships in Control (Ctrl.), Cold (C), Menthol (M), and Cold+menthol (C + M) conditions of cells in A. D, Scatter plots with mean and SD of the V1/2 values. E, Scatter plots with mean and SD gmax values estimated in the Cold+menthol condition. Statistical significance was assessed with a two-tailed unpaired Student's t test with Welch's correction (V1/2 Cold: t(29) = 2.18, p = 0.0377; V1/2 Menthol: t(29) = 0.55, p = 0.5870; V1/2 Cold+menthol: t(29) = 0.88, p = 0.3875; gmax: t(29) = 0.30, p = 0.7625). *p < 0.05. **p < 0.01. n > 14 cells for each condition.
