Figure 1.

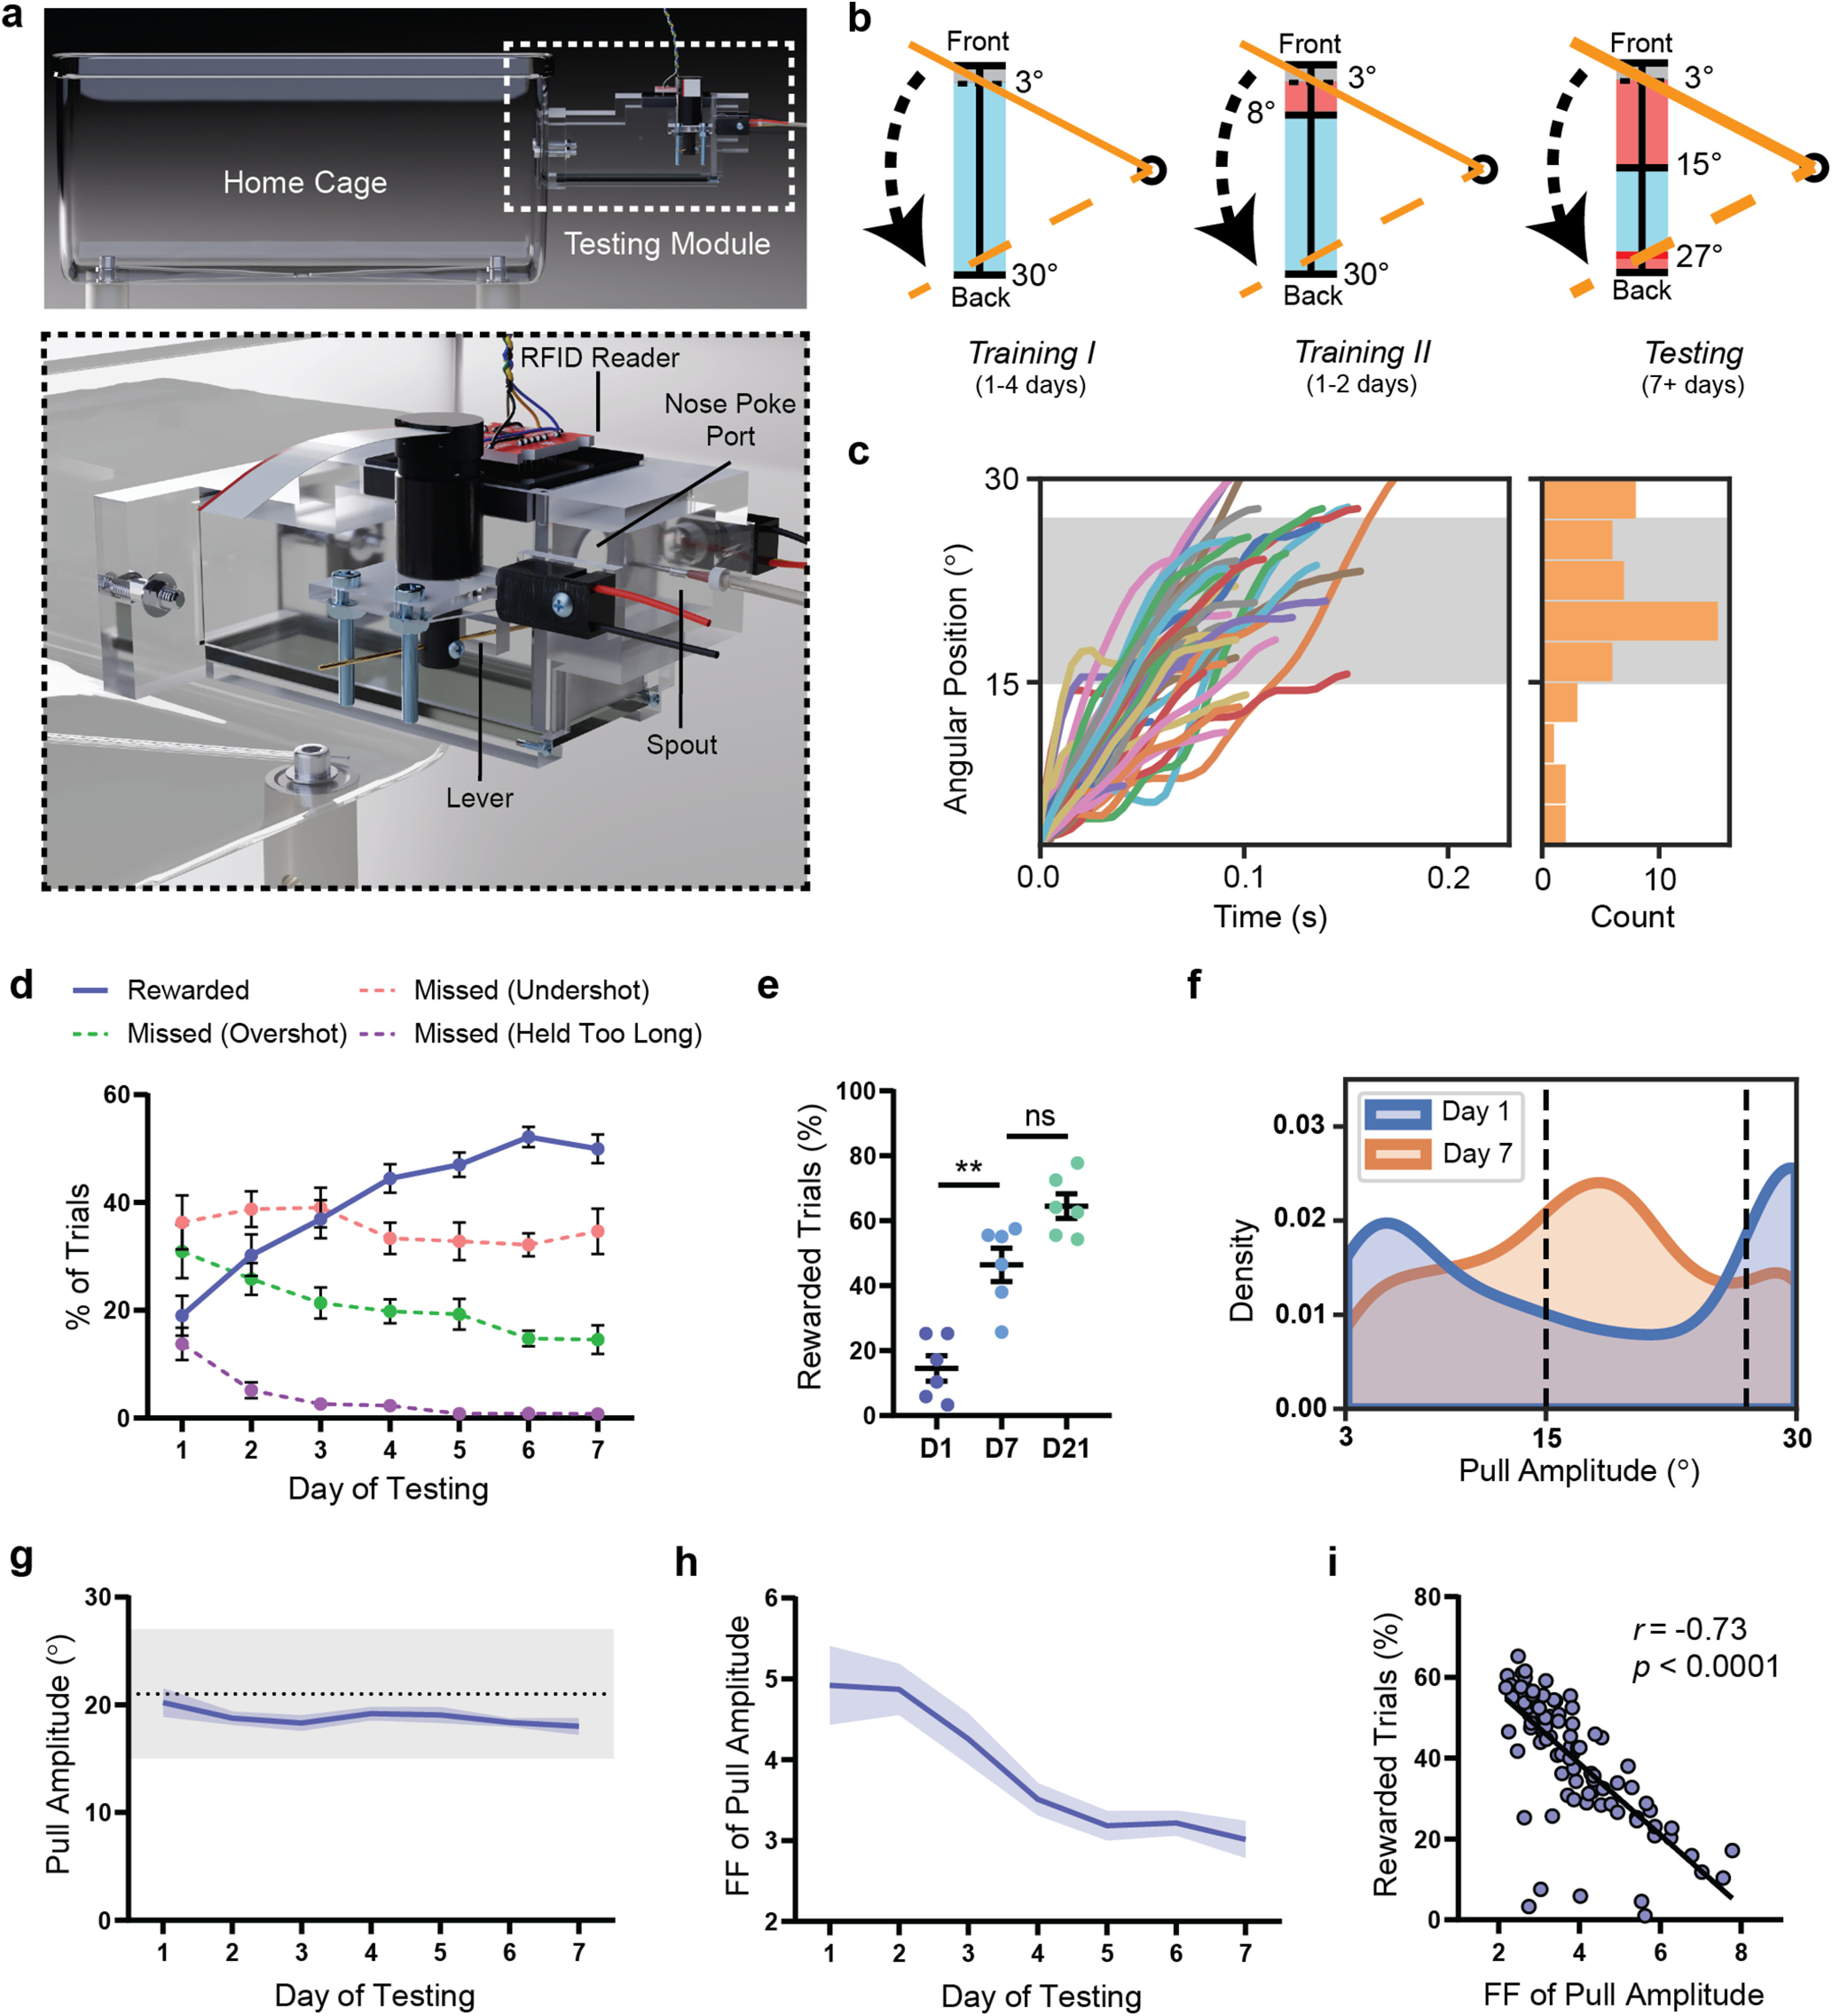
WT mice improve their performance of the PiPaw task by decreasing the intertrial variability of pull amplitude. a, A small testing module was attached to the mouse home cage containing a lever, a nose-poke port, and a spout which delivered water drop rewards. An RFID reader would detect and identify animals on entrance into the chamber and load the appropriate testing parameters. In order to perform a trial, the mouse was required to nose-poke and simultaneously pull the lever using its right forelimb. b, The lever was held in its starting position at the front of the lever position range by the motor until a trial was initiated. In all testing phases, the mouse initiated a trial by pulling the lever backwards out of the threshold range (0°-3°, shown in gray). In Training I, a water drop reward was given for all trials, regardless of pull amplitude, as long as the lever was returned back to the start position before the trial time limit (2 s). In Training II, the trial was rewarded only if the amplitude of the pull (i.e., maximum position of the lever during the trial) was >8°. In the Testing phase, the rewarded pull amplitude range narrowed to between 15° and 27°. If the amplitude of the pull was <15° (undershot) or >27° (overshot), the trial was not rewarded. c, Lever position versus time traces (n = 50 trials) for a representative WT mouse on the seventh day of testing. Histogram represents the amplitude of displayed trials. Gray-shaded area represents the rewarded pull amplitude range. d, WT mice (n = 13) increased their proportion of rewarded trials (p < 0.0001) and decreased their proportion of overshot trials (p < 0.0001) and trials held for longer than the trial time limit (p < 0.0001) over 1 week of testing. The proportion of undershot trials remained relatively stable (p = 0.32). e, The proportion of rewarded trials did not increase significantly past day 7 of testing in a group of WT mice (n = 7) assessed on the task for 3 weeks. f, Kernel density estimate plot of pull amplitude across trials for all WT mice (n = 13) on the first and seventh days of testing. g, The average pull amplitude for WT mice (n = 13) over 1 week of testing did not change significantly (p = 0.12). Gray shaded region represents the rewarded pull amplitude range. h, The Fano factor () FF of pull amplitude calculated for each day decreased significantly over 1 week of testing (p < 0.0001) in WT mice (n = 13). i, The Fano factor of pull amplitude for each mouse on each day was correlated with daily reward rate for that mouse (n = 91 mouse-days). Data are mean ± SEM.
