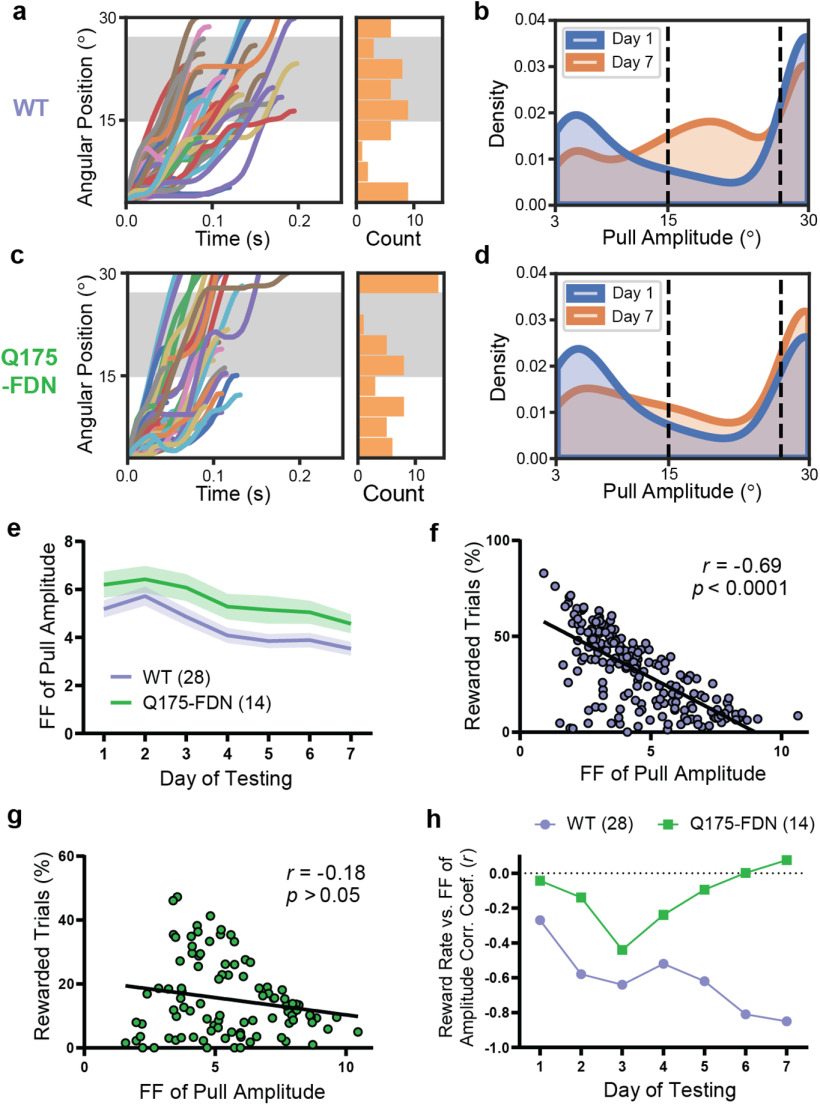
Figure 5.
Q175-FDN mice are unable to modulate the intertrial variability of pull amplitude to improve task performance. a, Lever position versus time traces (n = 50 trials) for a representative WT mouse on the seventh day of testing. Histogram represents the amplitude of displayed trials. Gray-shaded area represents the rewarded pull amplitude range. b, Kernel density estimate plot of pull amplitude across trials for all WT mice (n = 28) on the first and seventh days of testing. c, Lever position versus time traces (n = 50 trials) for a representative Q175-FDN mouse on the seventh day of testing. d, Kernel density estimate plot of pull amplitude across trials for all Q175-FDN mice (n = 14) on the first and seventh days of testing. e, The Fano factor of pull amplitude calculated for each day was significantly higher in Q175-FDN compared with WT mice (p = 0.035), although it decreased over time in both genotypes (p < 0.0001). f, The Fano factor of pull amplitude for each WT mouse on each day was correlated with daily reward rate for that mouse (n = 196 mouse-days). g, Fano factor of pull amplitude was not correlated with daily reward rate in Q175-FDN mice (n = 98 mouse-days). h, Correlation coefficient of Fano factor of pull amplitude and reward rate for WT and Q175-FDN mice across 7 d of testing. The correlation is significant for WT mice from day 2 onwards but is not significant in Q175-FDN mice on any day. All data are from mice tested on the amplitude task and are presented as mean ± SEM.

