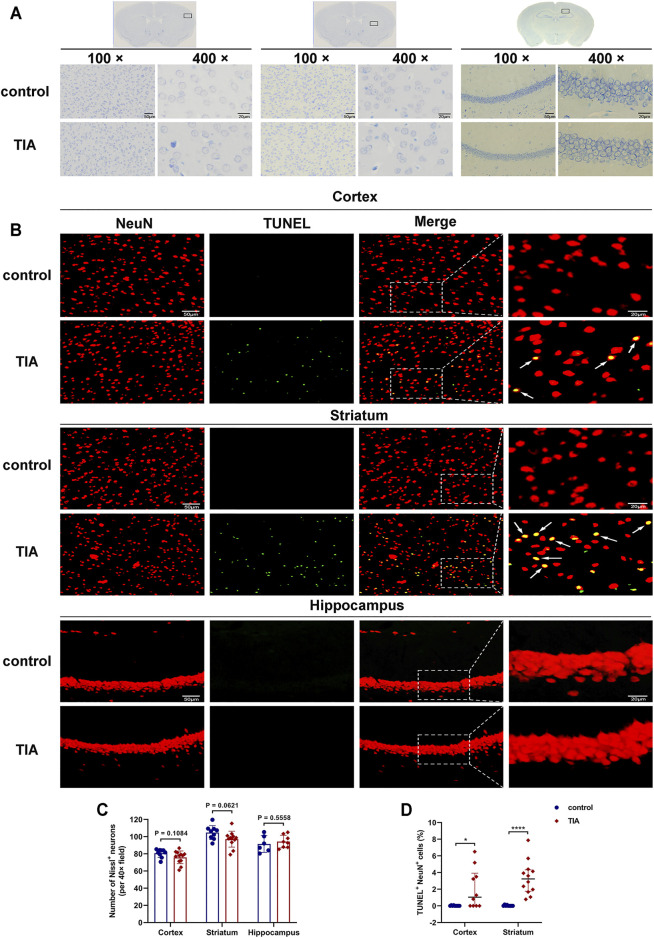
FIGURE 4.
TUNEL and NeuN fluorescent double-label staining indicated neuronal apoptosis after TIA. (A) Nissl-stained images of the cortex, striatum and hippocampus (100×, scale bar = 50 μm; 400×, scale bar = 20 μm). (B) Representative TUNEL staining for neuron (red) and TUNEL (green) in cortex, striatum and hippocampus acquired from the ischemic hemisphere of control and TIA mice. Low-magnification, full field (scale bar = 50 μm) and high-magnification, partial visual fields (indicated by the white frame; scale bar = 20 μm) were displayed. Arrow points represented apoptotic neurons. (C) Bar graphs showing the number of intact neurons in the ipsilateral cortex, striatum and hippocampus of the control and TIA groups (n = 3 and 4, respectively). Data were presented as mean ± SD and determined by unpaired t-test. (D) Dot plots showing the percentage of TUNEL and NeuN double-positive cells in the ischemic hemisphere. Data were presented as median and interquartile range and determined by Mann-Whitney U test. < 0.05; < 0.0001 control group vs. TIA group.

