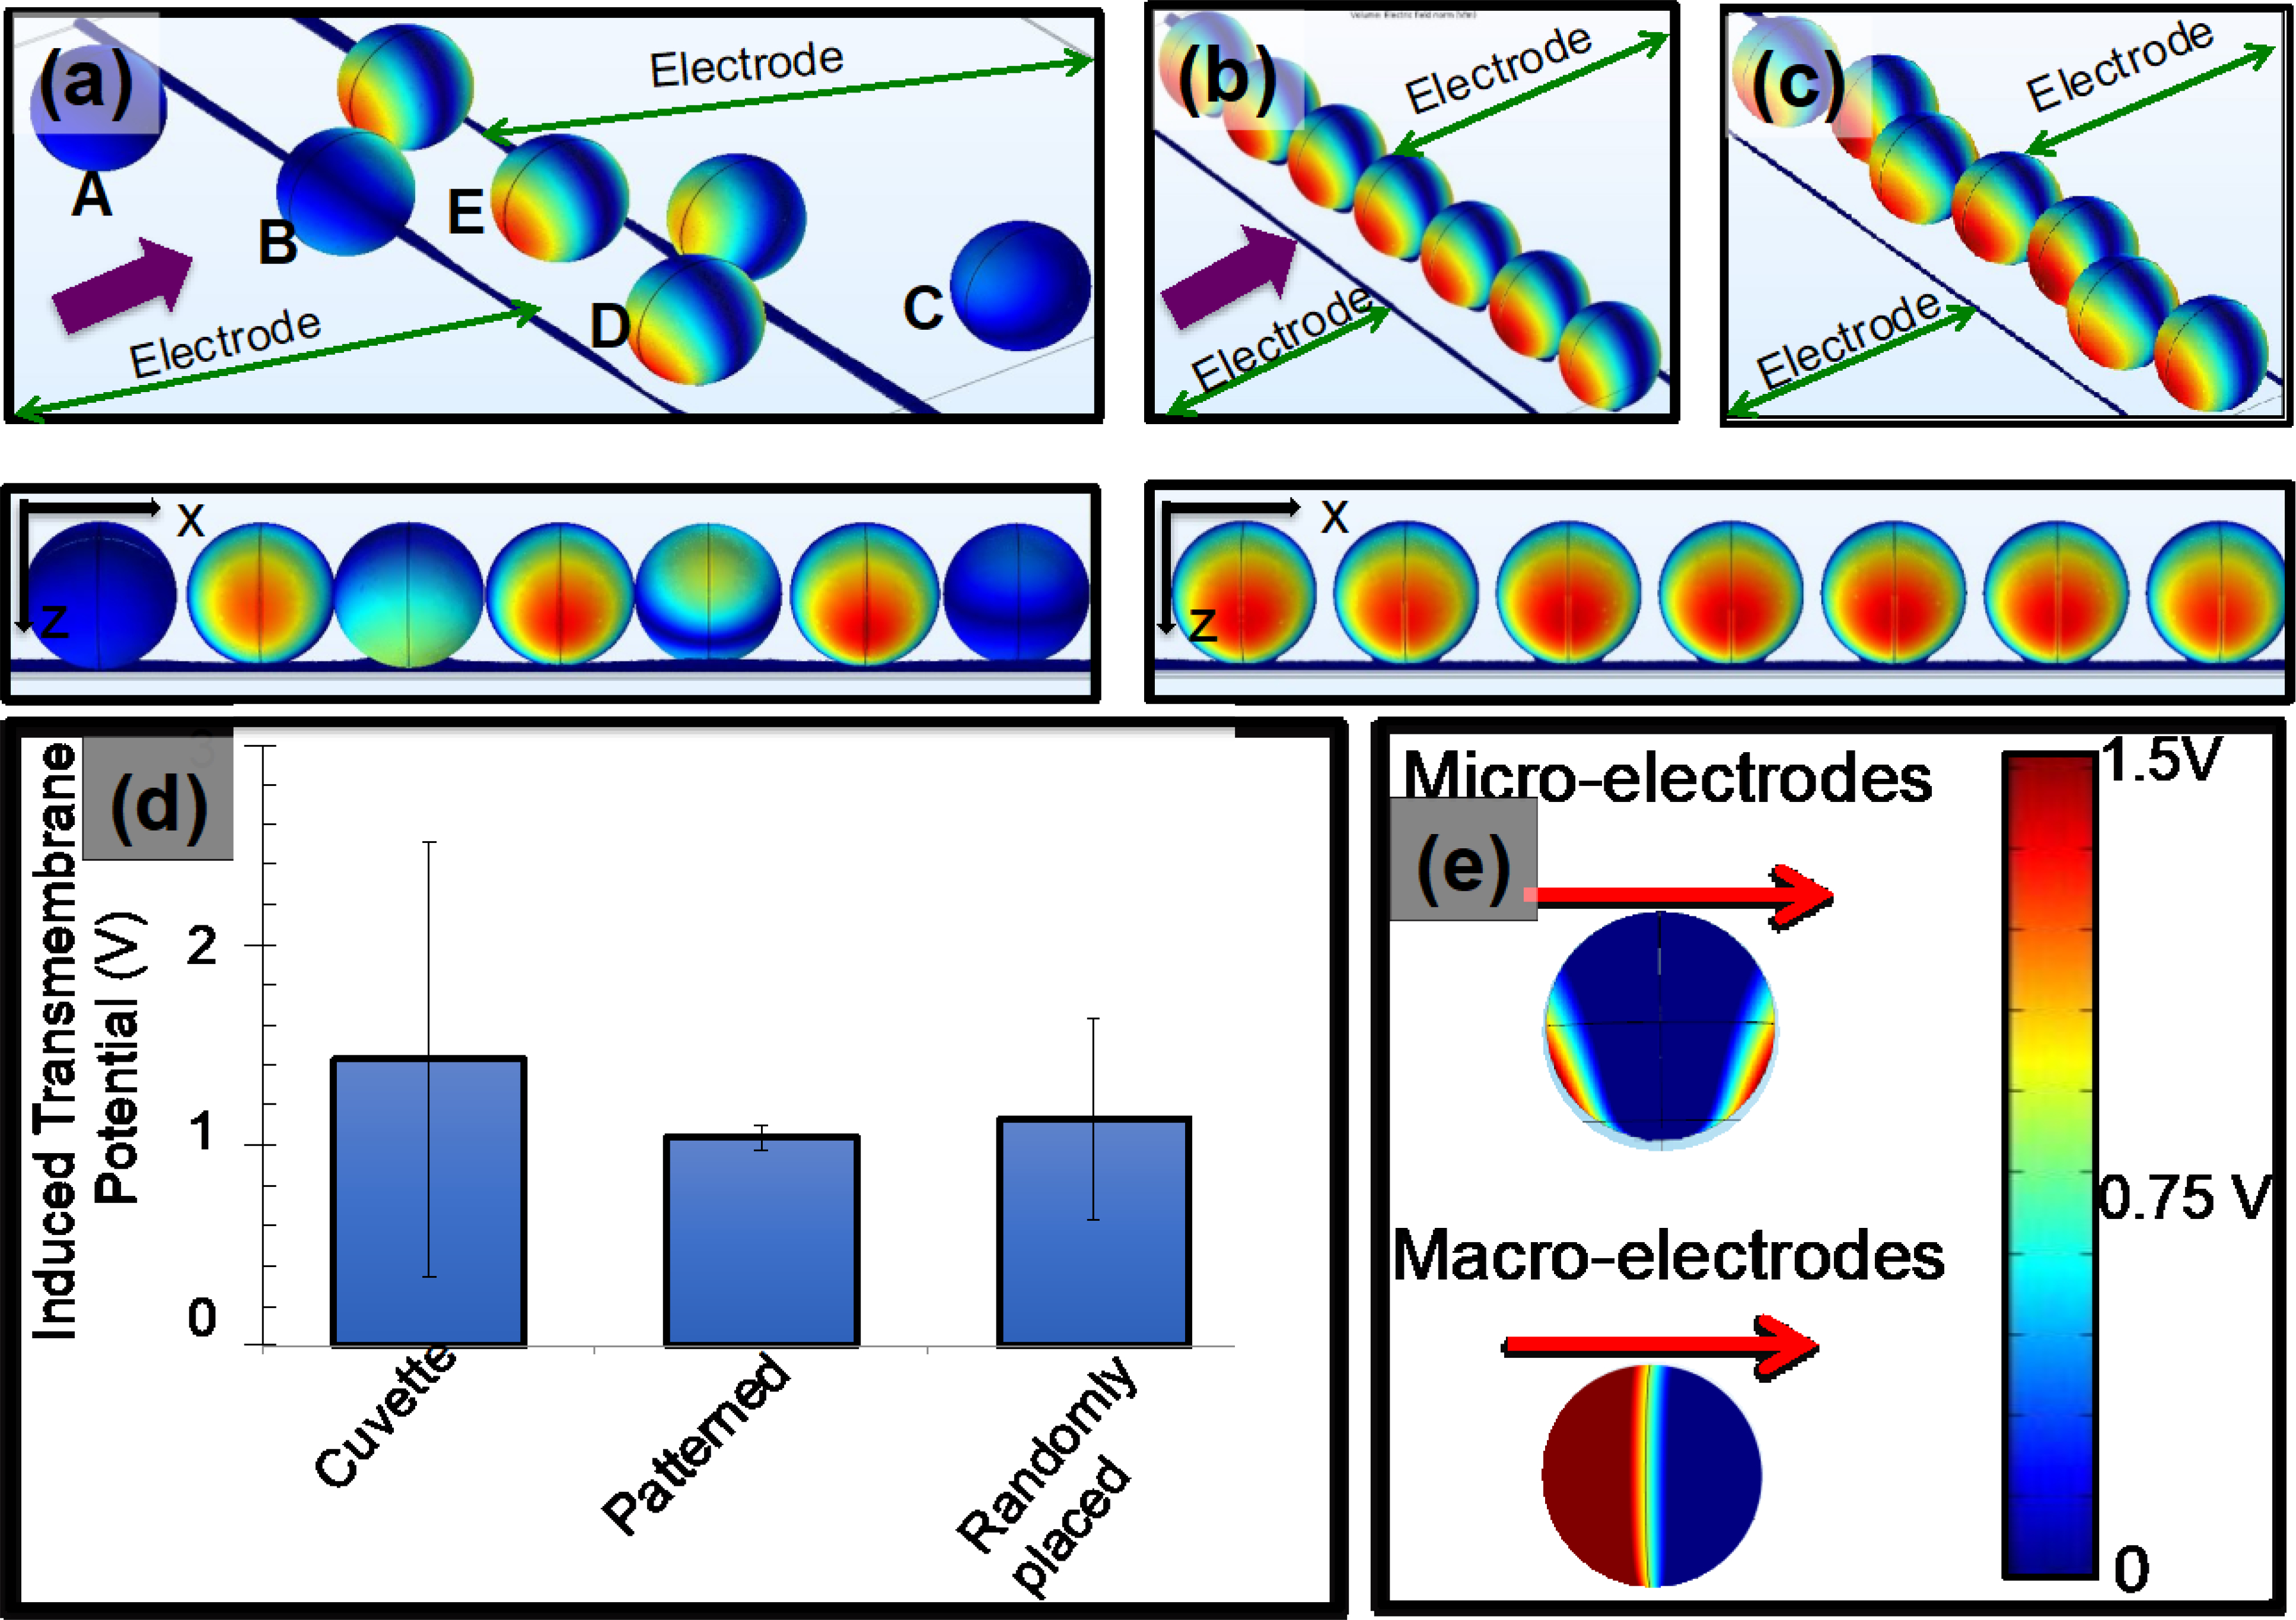
Figure 2:

Calculated induced potential values of the patterned and randomly placed cells on interdigitated electrodes. The diameter of each T-cell was 7μm. (a) Isometric view shows the locations of cells with respect to electrodes of the randomly placed cells and their induced membrane potential values. The external electric potential was applied between interdigitated electrodes. The figure shows only a section of interdigitated electrodes. The figure right below (a) shows 2-D view of the calculated induced membrane potential values in (a). (b and c) Calculated induced potential values of patterned T-cells between electrodes. Moreover, (b) and (c) show two configurations of T-cell patterns. Figures right below show the 2-D view of the calculated induced membrane potentials. (d) Numerical values of calculated induced membrane potential values of patterned, randomly placed and cells placed on traditional cuvettes. Moreover, cuvettes represent the traditional macro electrode-based electroporation devices. (e) Calculated induced electric potential values of a cell placed in micro-and macro-electrodes. The red arrows indicate the direction of the electric field. The legend shows the conversion of colors to numerical values for (a), (b), (c) and (e).
