Figure 3:

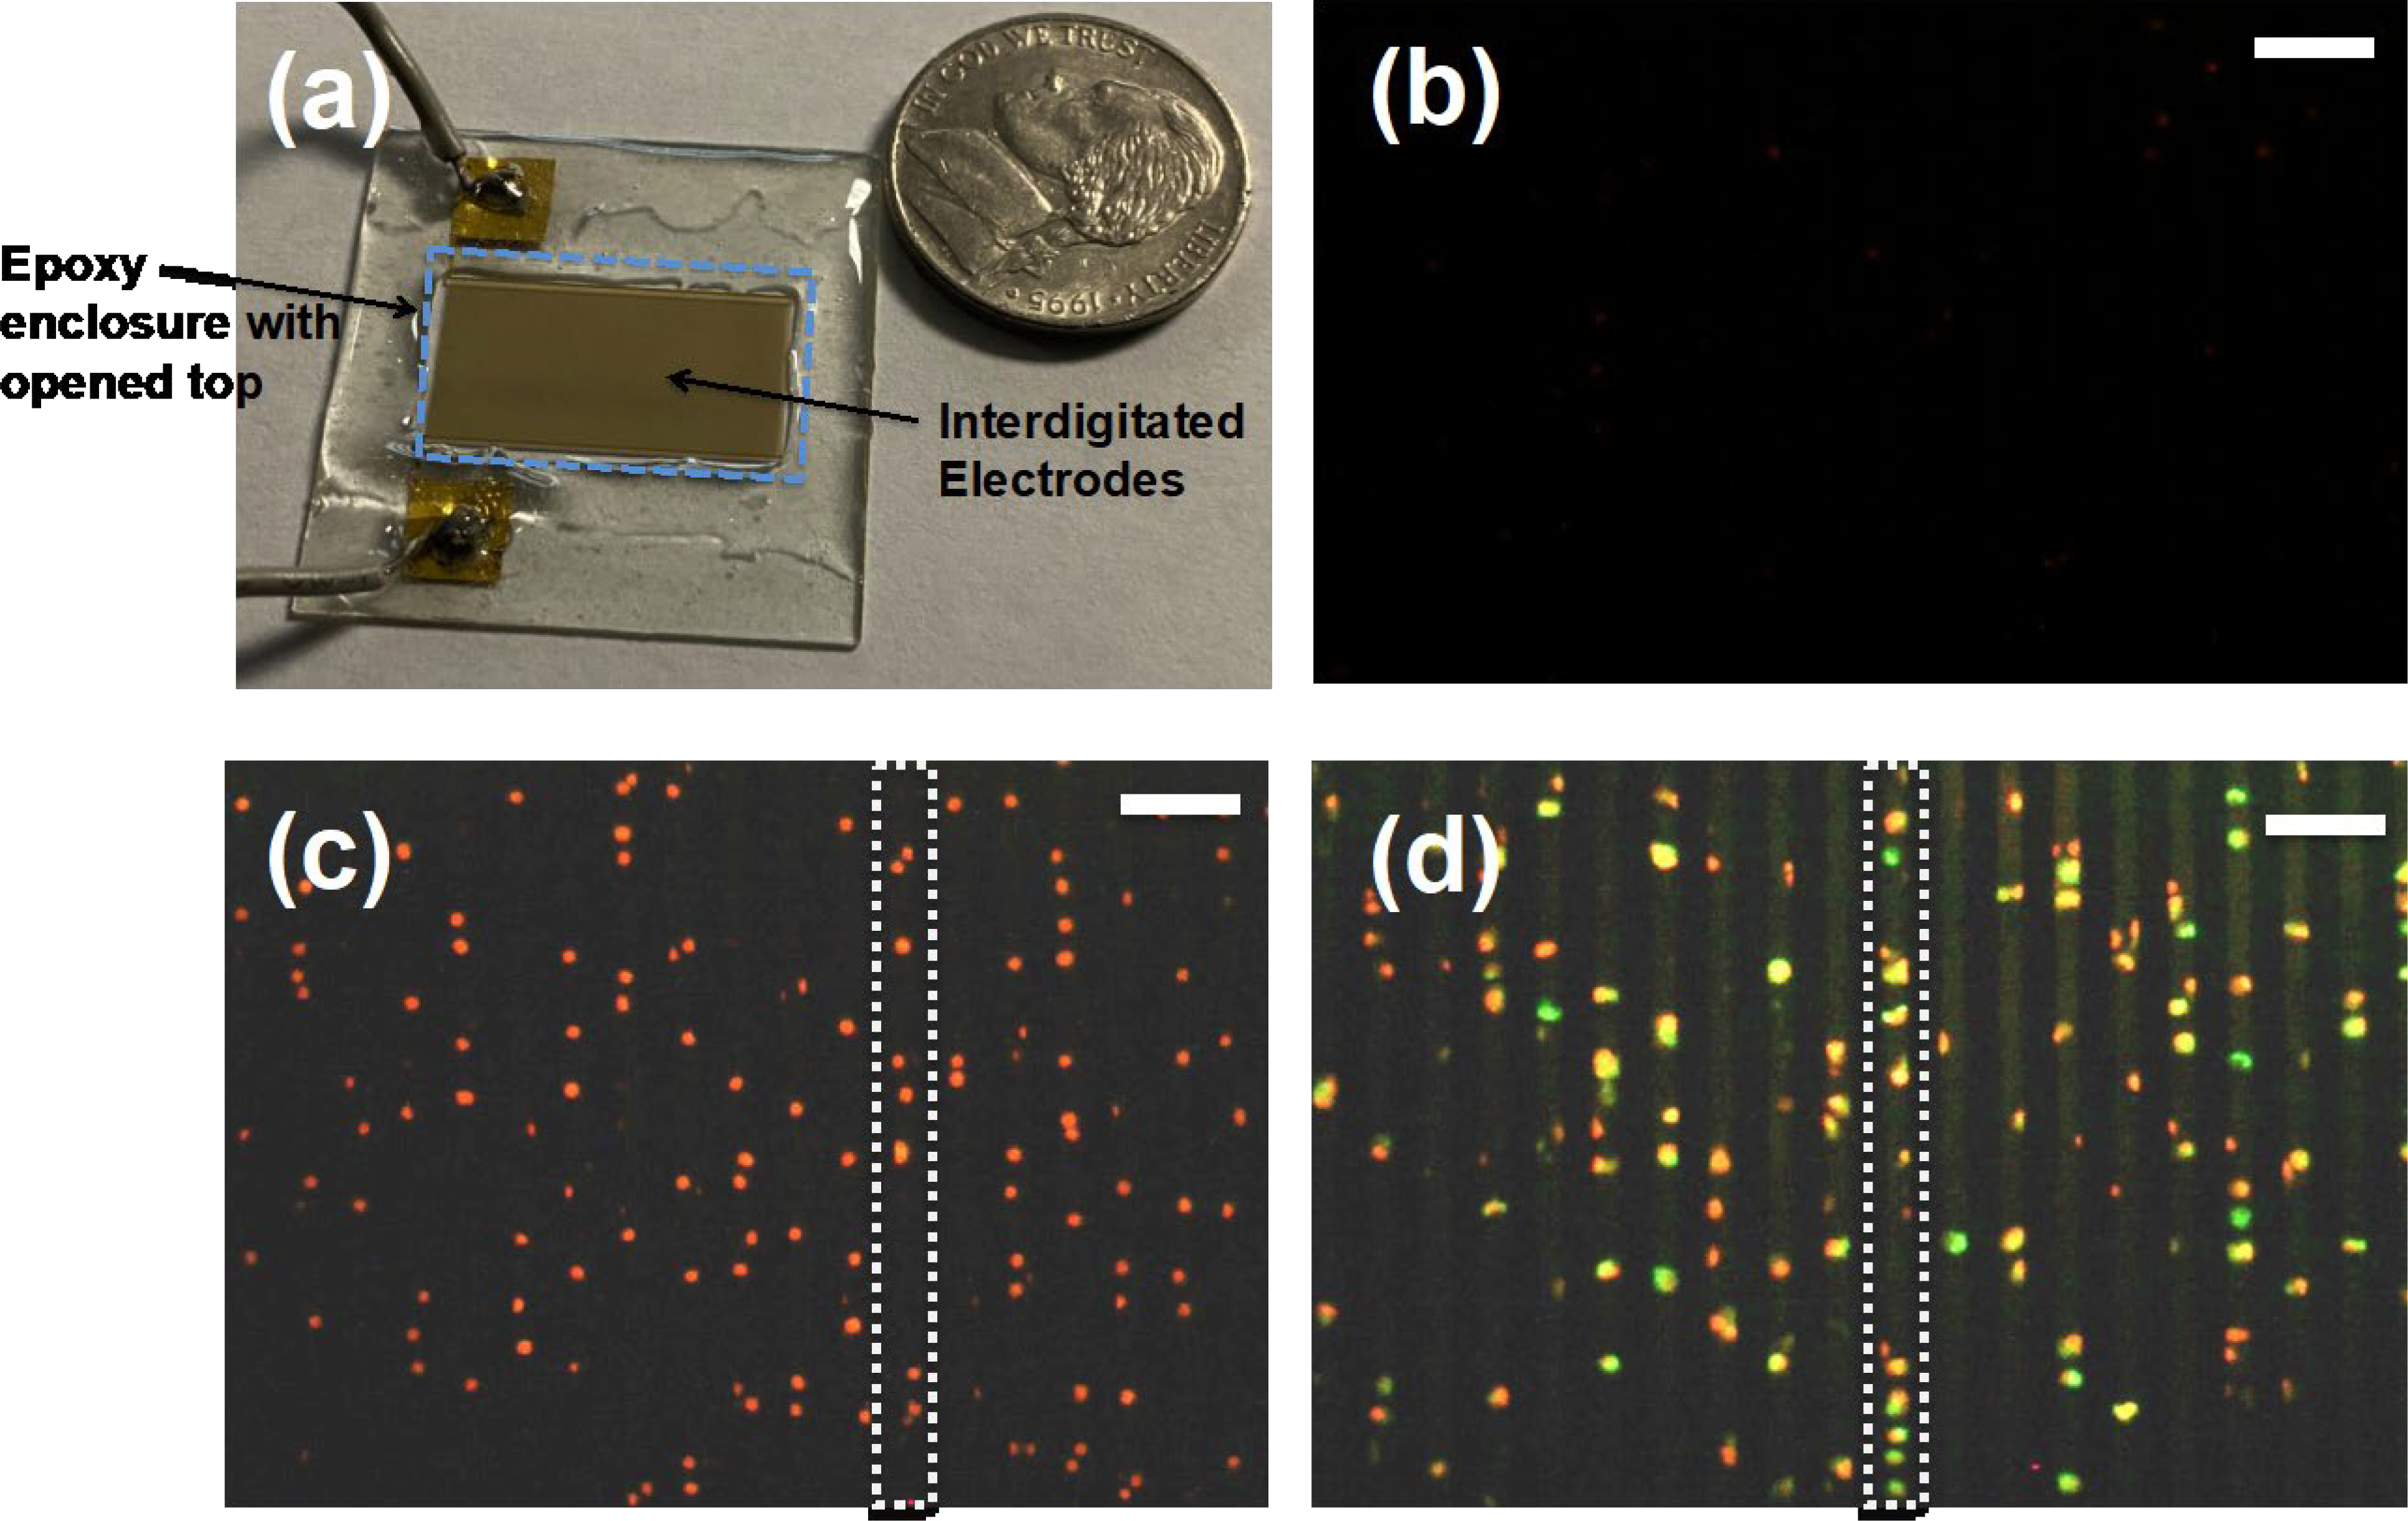
Steps of the CAR T-cell manufacturing using two-step electroporation. (a) Picture of a device used in experiments. In addition to interdigitated electrodes, we produced Epoxy enclosure with open top to avoid spill of cell sample beyond the electrodes. There were no infusion pumps to flow T-cell sample mixed with mRNA into the device. (b) Propidium iodide (PI) and Calcein molecules were used to demonstrate the transfection of T-cells in the device. Figure shows that fluorescence image of the patterned cells. (c) Fluorescence image of the cells after electroporation. T-cells were electroporated the PI molecules that are fluorescent. A rectangle with broken lines shows a single line of patterned T-cells. (d) After the electroporation with PI, cells were collected and stained with Calcein to evaluate the cell viability and pipetted back to the device, patterned and imaged. The images show a section of patterned cell sample. Yellow color cells indicate the stained cells with both PI and Calcein molecules. Rectangle with broken lines shows a single file of patterned cells. Scale bars in Figures 3(b, c and d) indicate 40 μm.
