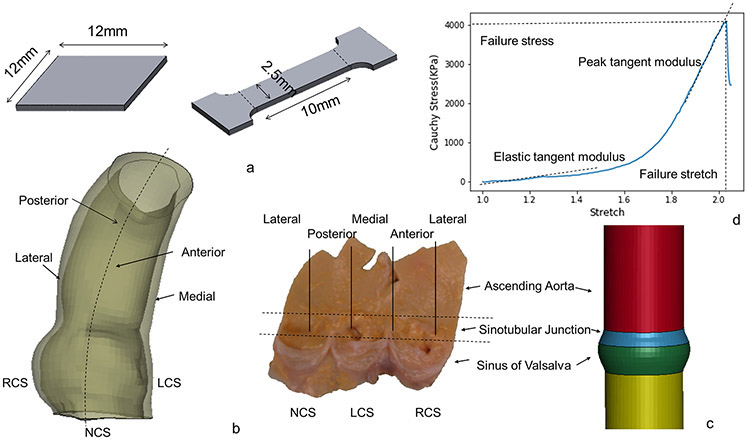
Figure 1a.
Sketch of biaxial and failure sample dimensions. 1b. Subregions of ascending aorta and aortic root. 1c. Sketch of the simplified model with distinct diameter and thickness. 1d. Representative plot of failure stress vs stretch. Dotted lines are labeled to describe the point where failure stress and stretch are measured. In addition, two dotted lines are labeled to describe the elastic and peak tangent moduli.

