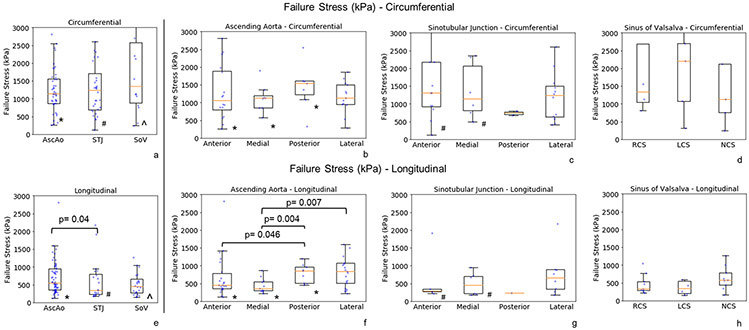
Figure 7:
Failure stresses at regions (a, e) and subregions (b-d, f-h) of aortic root and ascending aorta along the circumferential(a-d) and longitudinal directions (e-h). The raw data (dots) were overlaid on the median and (25%, 75%) interquartile range.
* denotes the statistically significant differences in ascending aorta between circumferential (circ) and longitudinal (long) directions - AscAo circ vs long, p=0.001; AscAo anterior circ vs long, p=0.003; AscAo medial circ vs long, p<0.001; AscAo posterior circ vs long, p=0.013.
# denotes the statistically significant differences in sinotubular junction between circumferential and longitudinal directions - STJ circ vs long, p<0.001; STJ anterior circ vs long, p=0.031; STJ medial circ vs long, p=0.015.
^ denotes the statistically significant differences in sinus of Valsalva between circumferential and longitudinal directions - SOV circ vs long, p<0.001.

