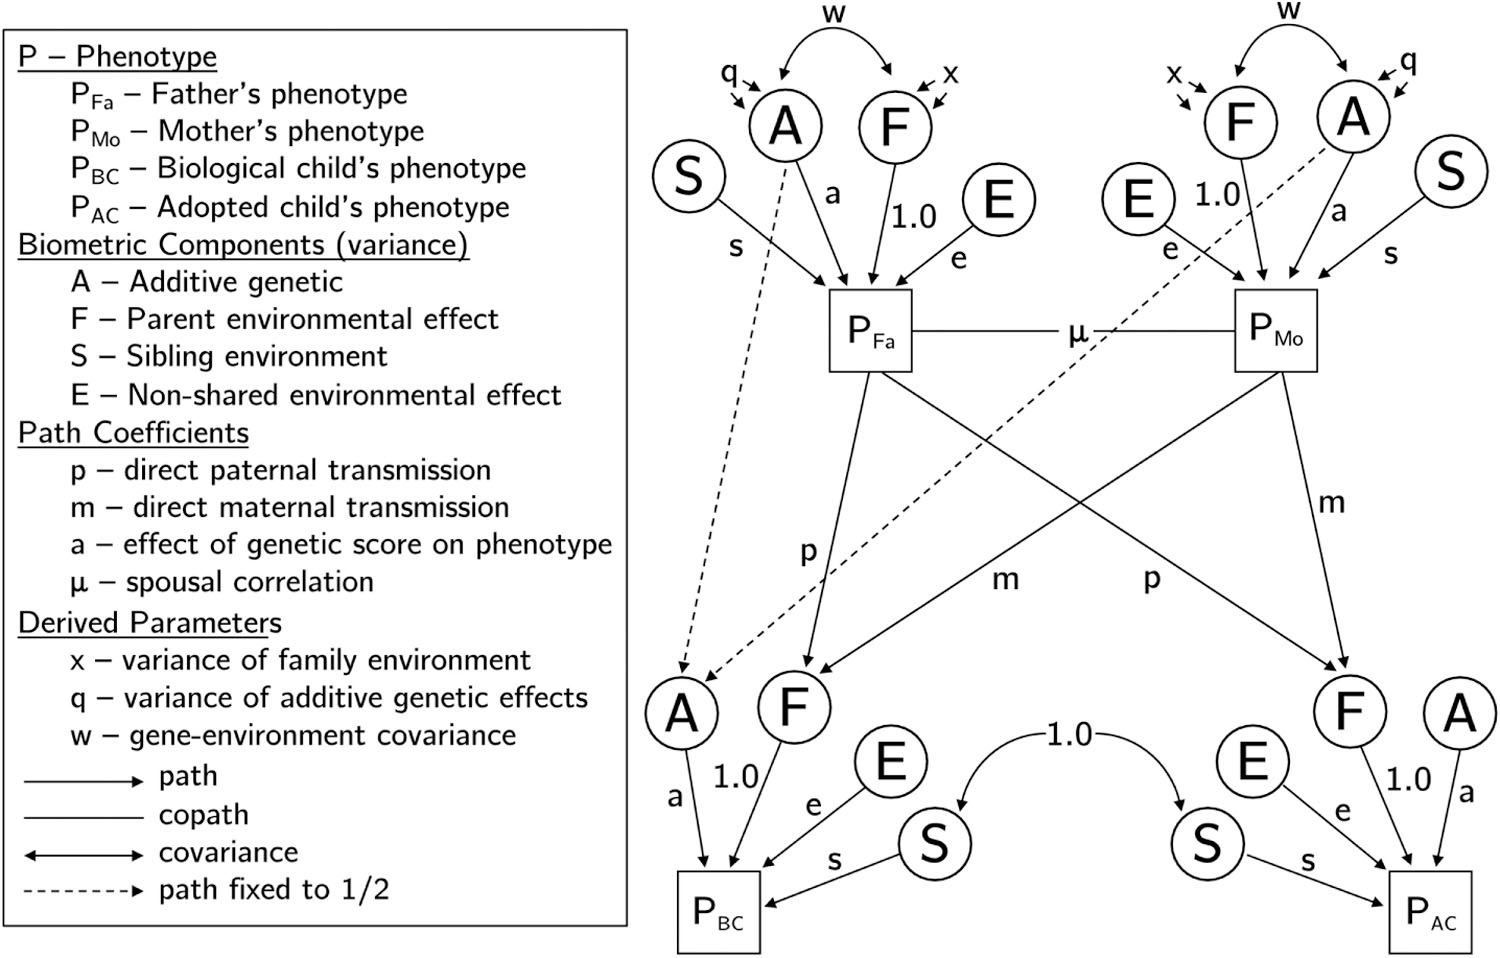
Figure 1:

Path diagram following Figure 1 from Keller et al. (2009) illustrating variance components and effects in an example family consisting of a father, a mother, one biological offspring, and one adopted offspring. Values for paths are as labeled except for the dashed paths from the genetic value of the parent to the genetic value of the biological offspring, which are fixed to 1/2 according to standard genetic theory. Components S and E have variance = 1; variance of F (x) and A (q) are noted in supplementary section 1.
