Figure 6.
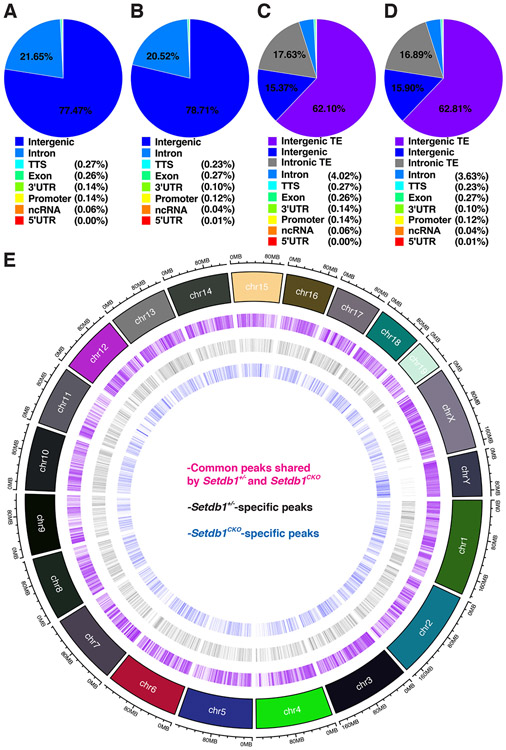
ChIP-Seq analysis reveals the disruption of global H3K9me3 deposition in Setdb1 knockout. See also Figure S4-7.
(A-D) Distribution of H3K9me3 in control (A and C) and Setdb1 mutant (B and D) peaks in spermatocytes with regard to genes vs intergenic regions (A and B) and transposons (TE) vs genes (C and D).
(E) A genome-wide map of H3K9me3 peaks that are common or unique to the control and Setdb1 mutant spermatocytes.

