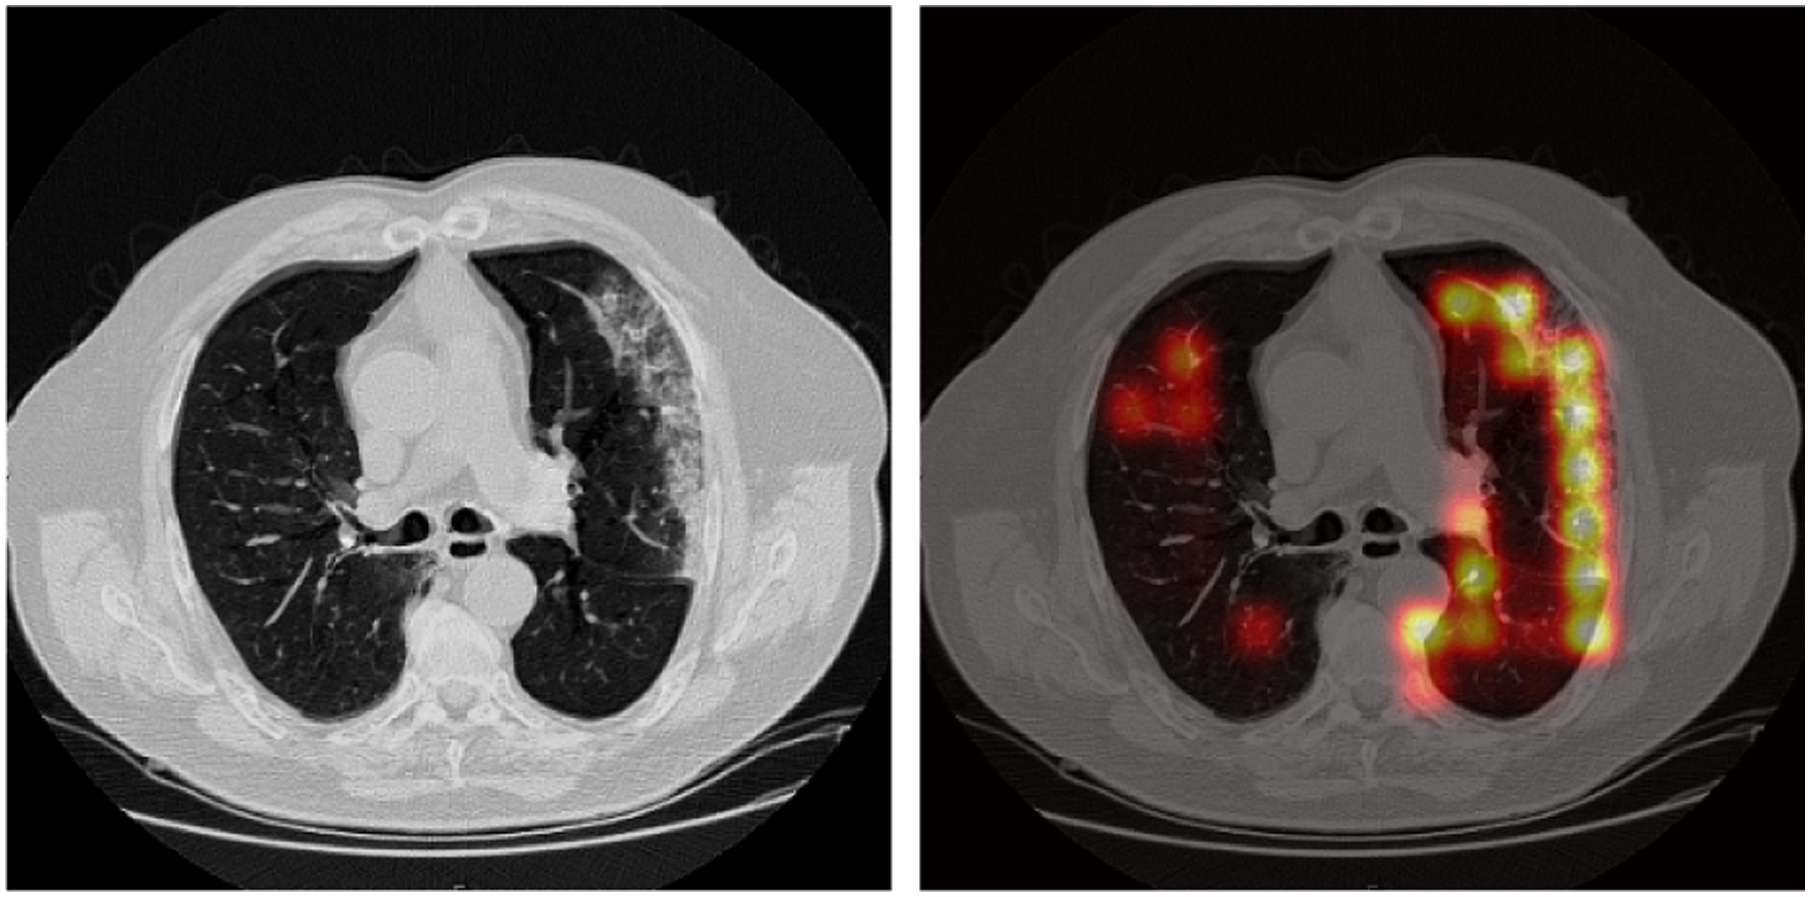
Figure 3:

An axial view of the activation heatmap on a COVID-19 positive subject in the COVID-19 CT dataset. Brighter color indicate higher relevance to the disease severity. The figure illustrates that high activation region overlaps with the ground glass opacities.
