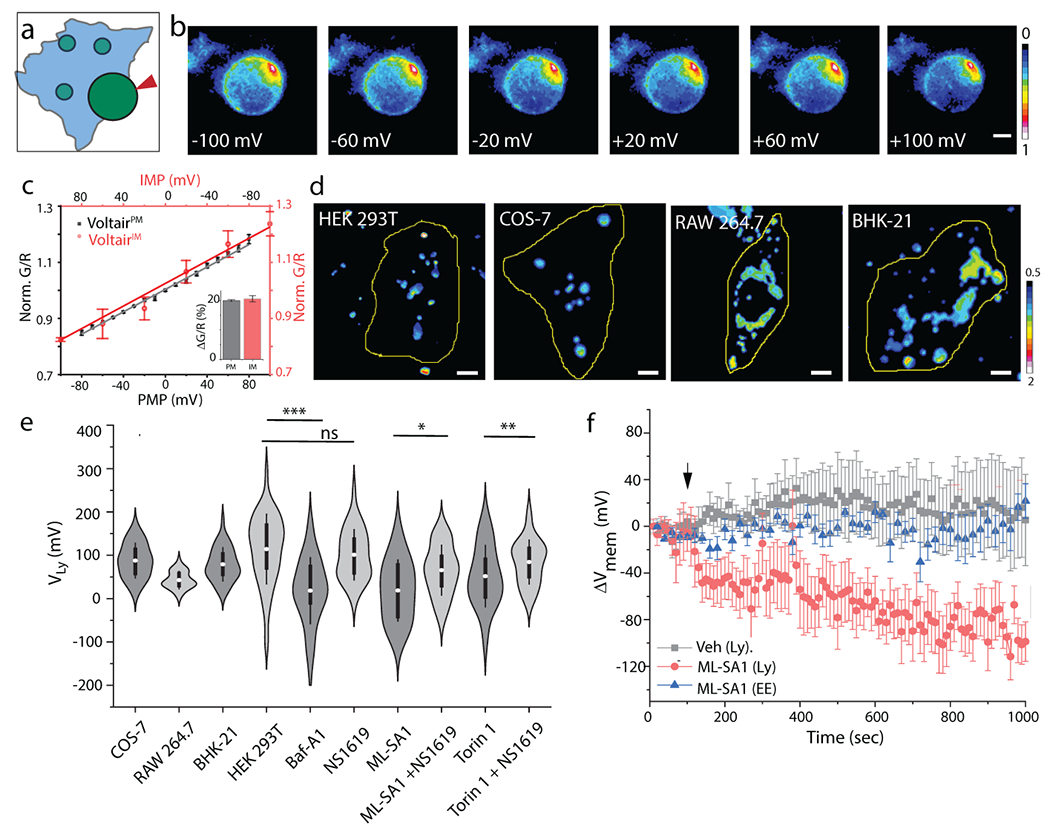
Fig. 3. VoltairIM measures lysosomal membrane potential:

(a) Schematic showing voltage clamping of enlarged lysosome labeled with VoltairIM. Red arrowheads indicate patch pipette. (b) Pseudo-color images show pixel-wise G/R ratio of VoltairIM labelled on the inner leaflet of lysosomes as a function of membrane potential applied by whole lysosome voltage clamping. (c) Sensor response of VoltairPM (gray trace, square) and VoltairIM (red trace, circle) as a function of membrane potential (PMP: Plasma membrane potential, IMP: Intracellular membrane potential). Gray error bars indicate mean ± s.d., n = 6 cells. Red error bars indicate mean± s.d., n = 4 lysosomes. Inset: Percentage change in signal of VoltairPM (black) and VoltairIM (red) from 0 to 100 mV in (c). (d) Representative pseudocolor G/R images of the VoltairIM labeled lysosomes from different cell types. Scale bar = 5 μm. (e) Measured lysosomal resting membrane potential values (VLys) of COS-7, RAW 264.7, BHK-21 cells and HEK 293T values in presence of V-ATPase inhibitor Bafilomycin (Baf-A1, 500 nM), mTORC1 inhibitor Torin-1 (1 μM), the TRPML1 activator ML-SA1 (20 μM), and the Slo1 activator, NS1619 (15 μM). Violin plots show kernel smooth distribution, box indicates interquartile range 25-75; Error bars indicate mean ± s.d. of 100 lysosomes; ns, not significant (P > 0.05); **P < 0.01; *P < 0.05 (Unpaired two sample t-test). (f) Time-lapse plot of ΔVmem vs time upon TRPML1 activation in VoltairIM labeled lysosomes (red trace), in VoltairIM labeled Endosome (blue trace). DMSO (Veh.) treatment (black trace), Error bar represents mean ± s.d. from n = 10 cells. Experiments were repeated thrice independently with similar results.
