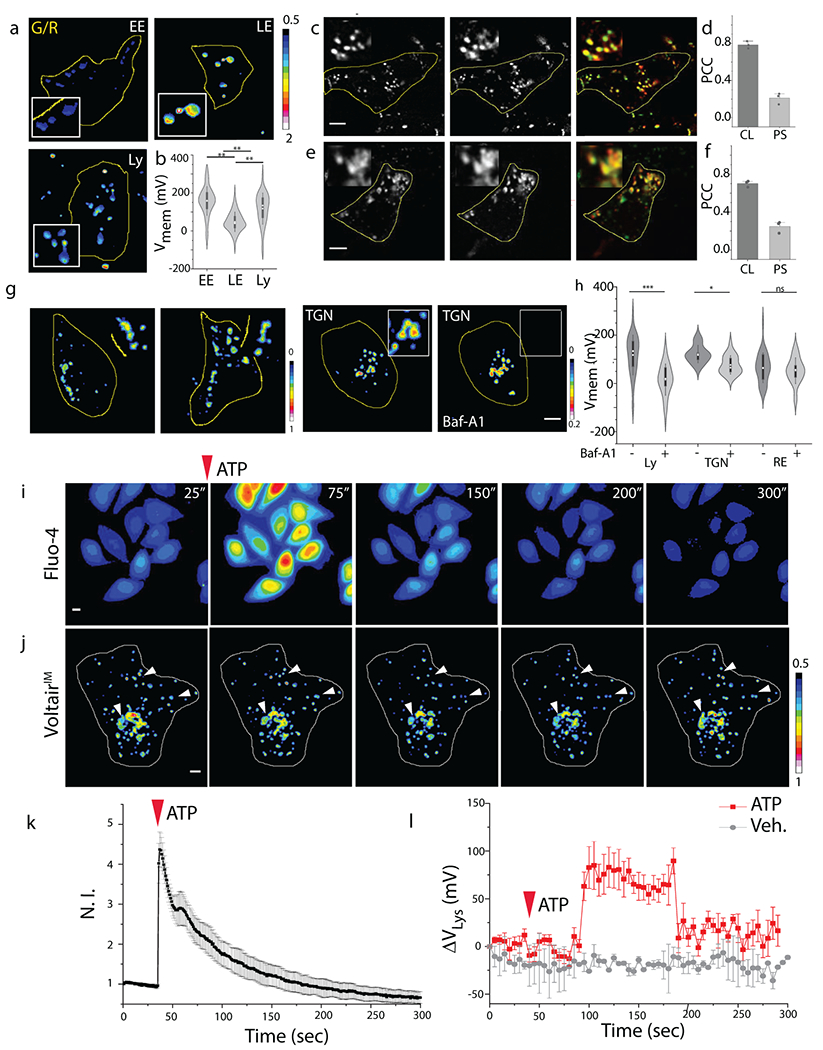
Fig. 4. Membrane potential of organelles along endocytic, recycling and retrograde trafficking pathway:

(a) Representative pseudocolor G/R images of the indicated organelles labeled with VoltairIM. Scale: 5 μm. (b) Measured membrane potentials of early endosomes (EE), late endosomes (LE) and lysosomes (Ly). Violin plots show kernel smooth distribution, box indicates interquartile range 25-75; Error bars indicate mean ± s.d. of 200 vesicles; **P < 0.01 (one-way ANOVA with Tukey post hoc test). (c) Colocalization between internalized VoltairRE (red channel) and recycling endosome marker (Transferrin-Alexa546, green channel) in HEK 293T cells. (d) Pearson’s correlation coefficient (PCC) of colocalization (CL) and pixel shift (PS) in (c). Error bar represents mean ± s.e.m. of three independent trials, n = 20 cells. (e) Colocalization between internalized VoltairTGN (red channel) and trans-Golgi network marker (TGN46-mCherry, green channel) in ScFv-Furin transfected HEK 293T cells. Scale = 5 μm, inset = 5 μm. (f) Pearson’s correlation coefficient (PCC) of colocalization (CL) and pixel shift (PS) in (e). Error bar represents mean ± s.e.m. of three independent trials, n = 20 cells. (g) Representative pseudo-color G/R images of RE and TGN of HEK 293T cells in absence and presence of bafilomycin A1 (500 nM). Scale = 5 μm. (h) Violin plot of resting membrane potential of organelles and changes upon inhibition of V-ATPase. Box indicates interquartile range 25-75; Error bars indicate mean ± s.d; ns, not significant (P > 0.05); ***P < 0.001, *P < 0.05 (one-way ANOVA with Tukey post hoc test). (i) Representative pseudo-color time lapse images of ATP induced cytosolic calcium increase imaged using Fluo-4 AM dye. Scale = 10 μm. (j) Representative pseudo-color time lapse images of G/R ratio from VoltairIM in presence of 100 μM ATP. White arrowheads highlight the lysosomes undergoing ATP induced hyperpolarization. (k) Quantification of (i) as a fluorescent intensity vs time plot, error bar represents standard deviation from n = 10 cells; Scale = 10 μm. (l) Quantification of (j) as a normalized G/R ratio from whole cell vs time plot, 100 μM ATP treated (Black trace), Untreated (red trace). Decrease in G/R (observed in movie) represents increase in positive membrane potential. Error bar represents standard deviation from n = 6 cells; Scale = 10 μm. Experiments were repeated thrice independently with similar results.
