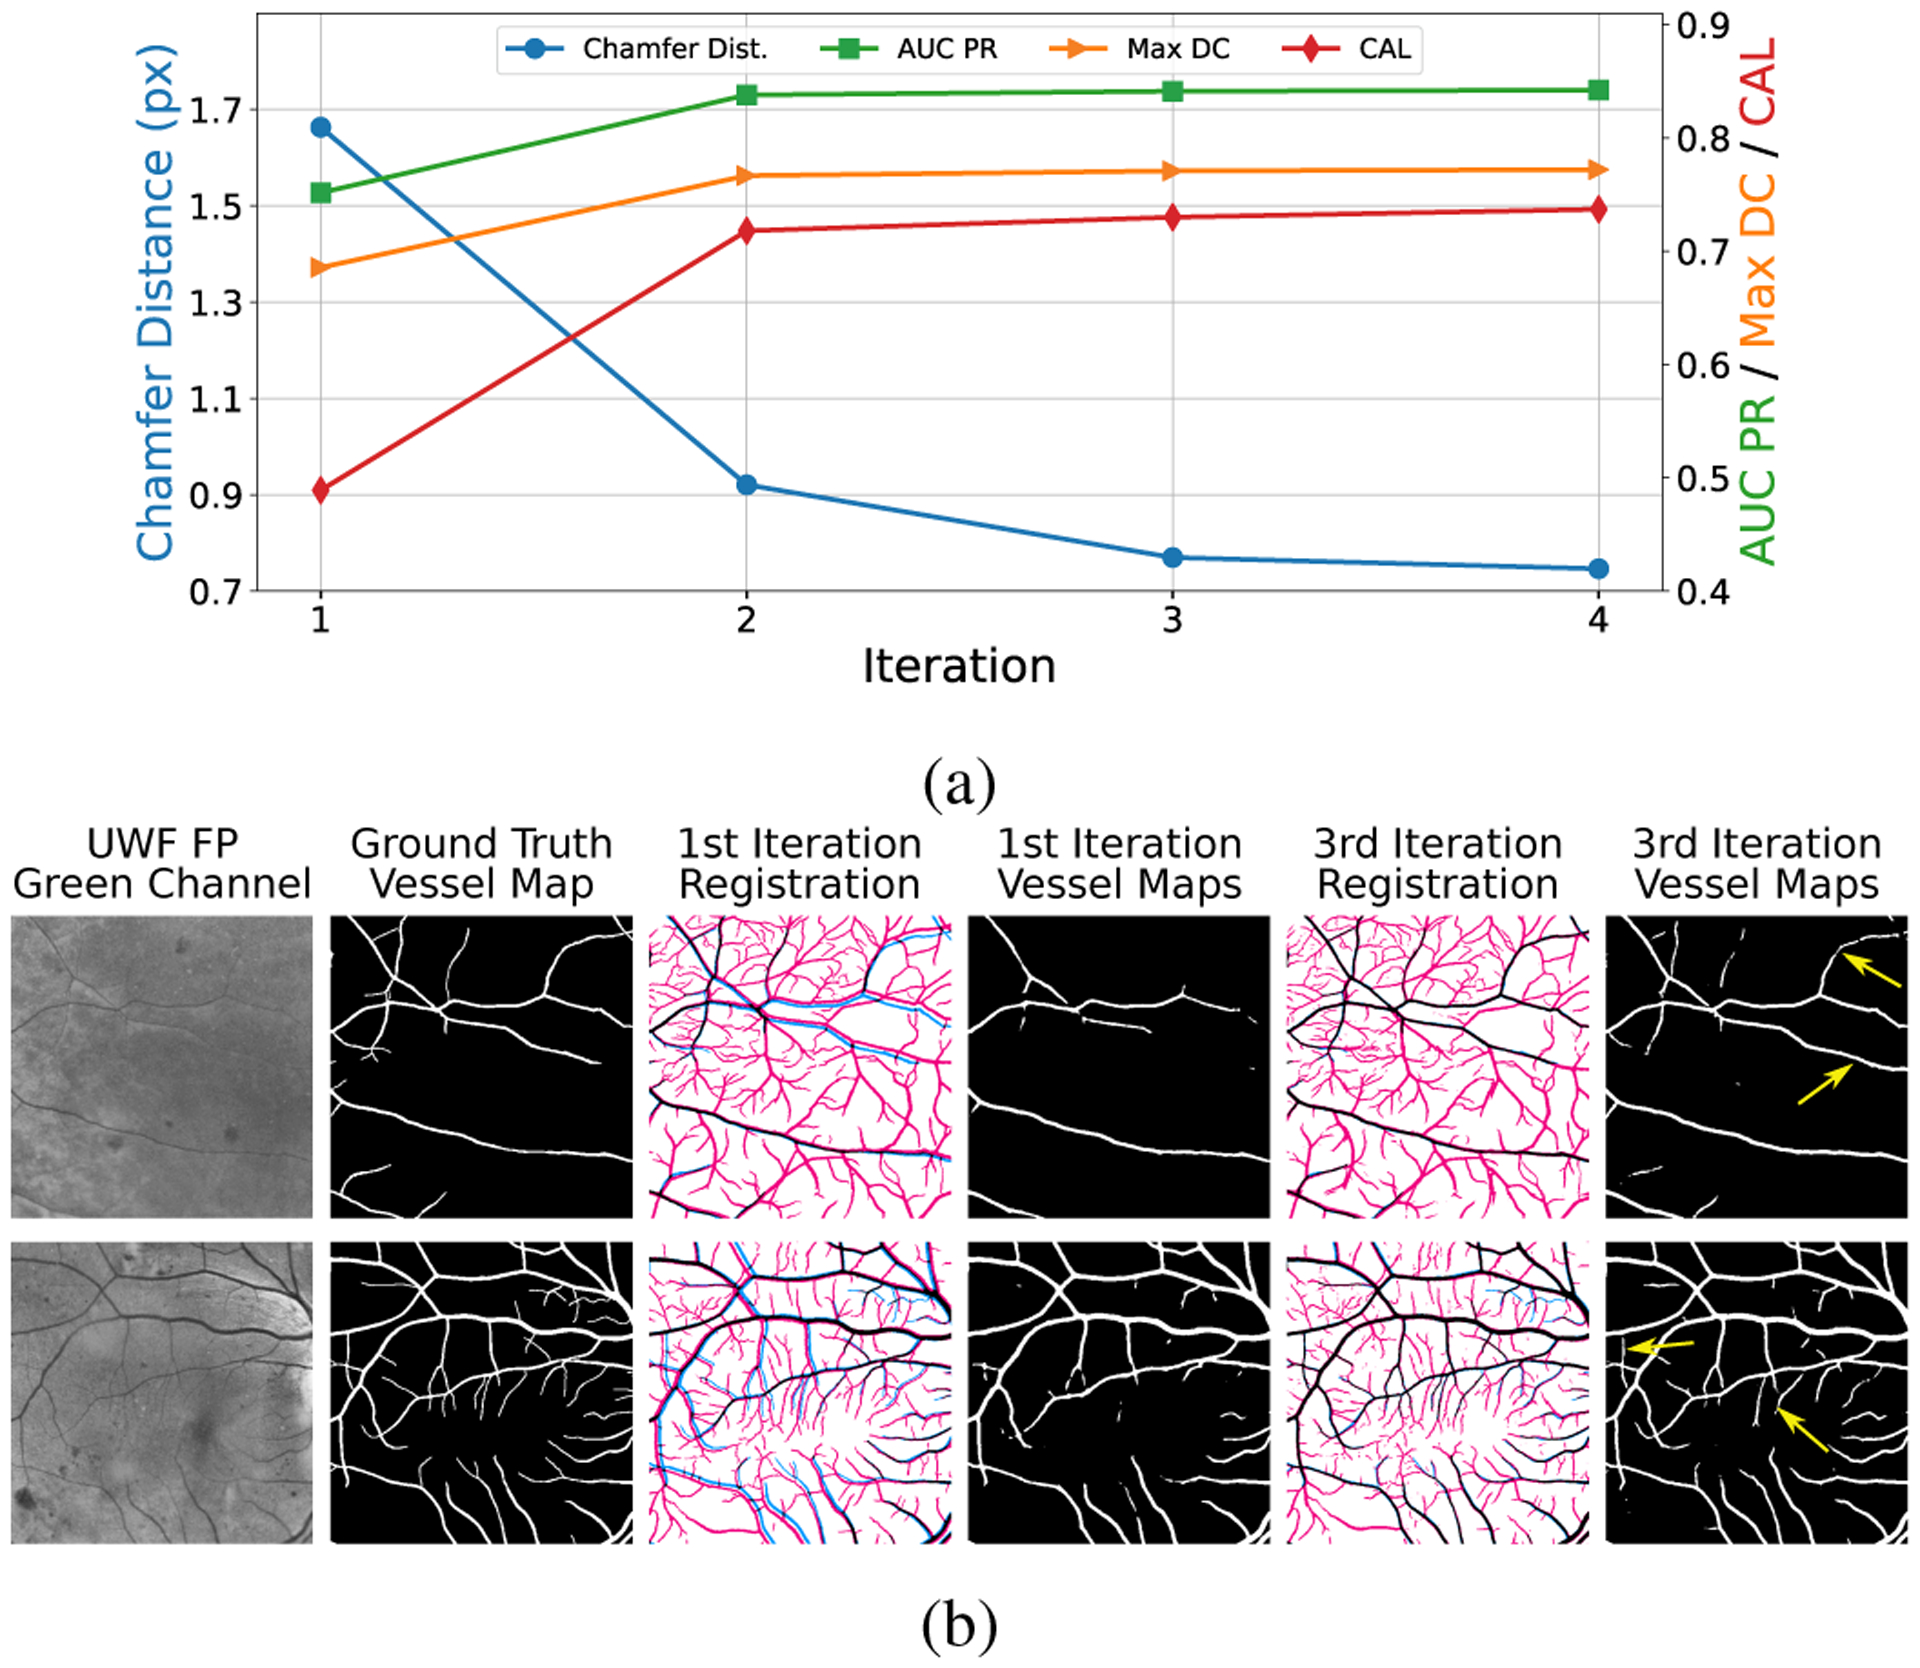
Fig. 5:

Registration and vessel detection performance as a function of iteration count. (a) the residual chamfer distance, which serves as a good proxy for the registration error, is labeled on the left axis. The axis on the right-hand side, with labels shown in different colors, corresponds to the metrics used for evaluating vessel detection performance. (b) Sample vessel maps obtained in the first and the third iterations. Red and blue pixels indicate incorrect vessel labels (“false positive”) and background labels (“false negative”), respectively, in the warped UWF FA vessel map.
