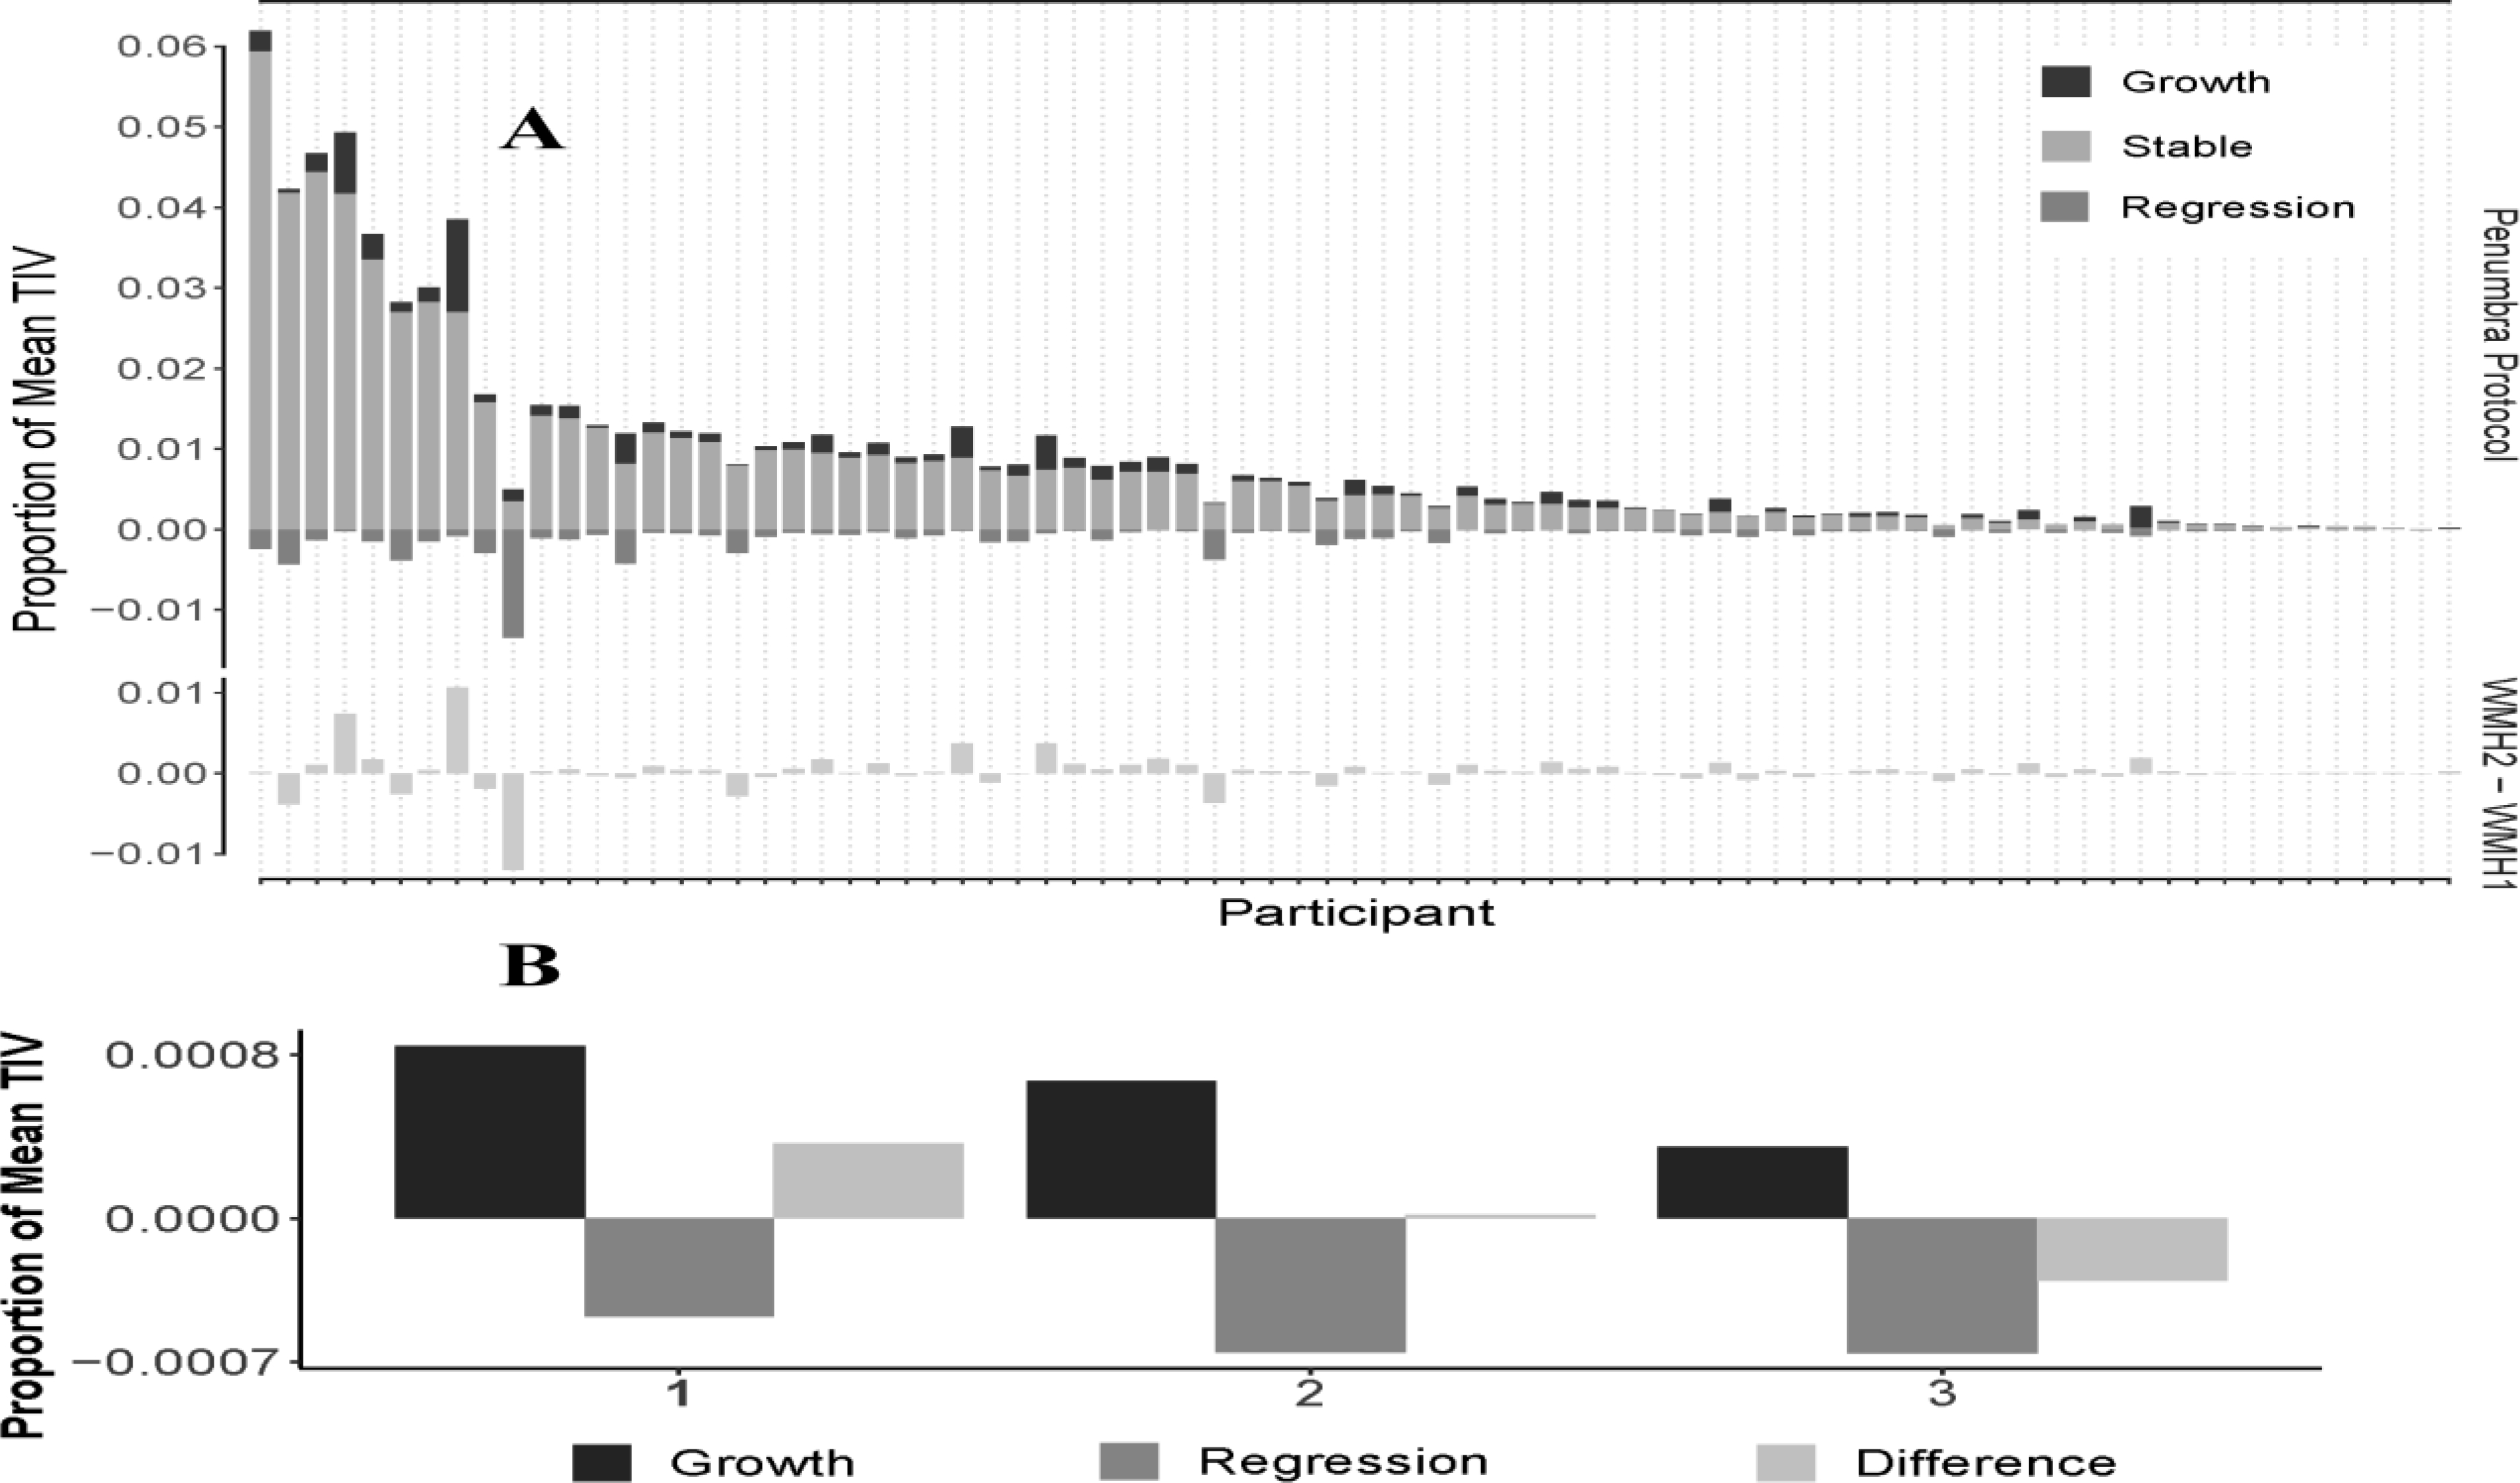
Fig. 8:

Longitudinal WMH for 79 participants. A) Participants are sorted greatest to least (left to right) by total WMH at first scan (i.e., WMH1 / TIV1). The top row of panels shows the growth, stable, and regression segmentations of WMH, as a proportion of mean TIV. The bottom row of panels shows the total WMH change as a proportion of mean TIV. B) Three different cases with WMH2-WMH1 compared to the longitudinal WMH results that demonstrate both growth and regression in WMH whereas the WMH difference shows only a single volume.
