Figure 5.
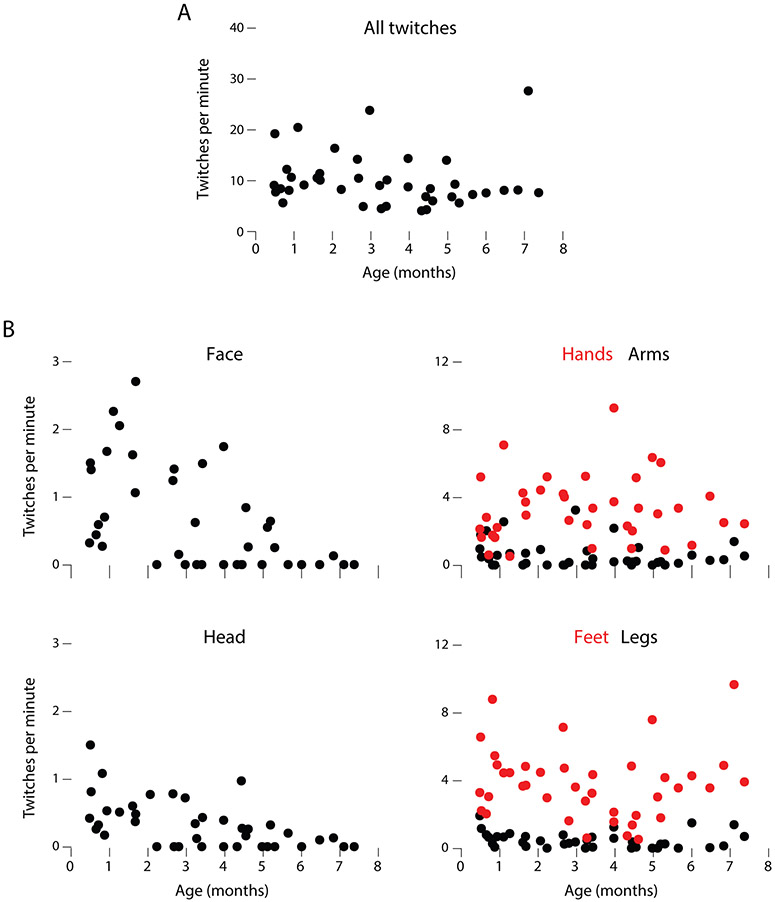
(A) Scatterplot of age-related changes in mean rates of twitching per minute of active sleep across all body segments. (B) Scatterplots of age-related changes in twitching across the six body segments. Data from left and right limbs were pooled. For clarity in these plots, five outliers were removed (one each for face, head, and legs; two for hands). Note different scales on y-axes. See text for statistical analyses.

