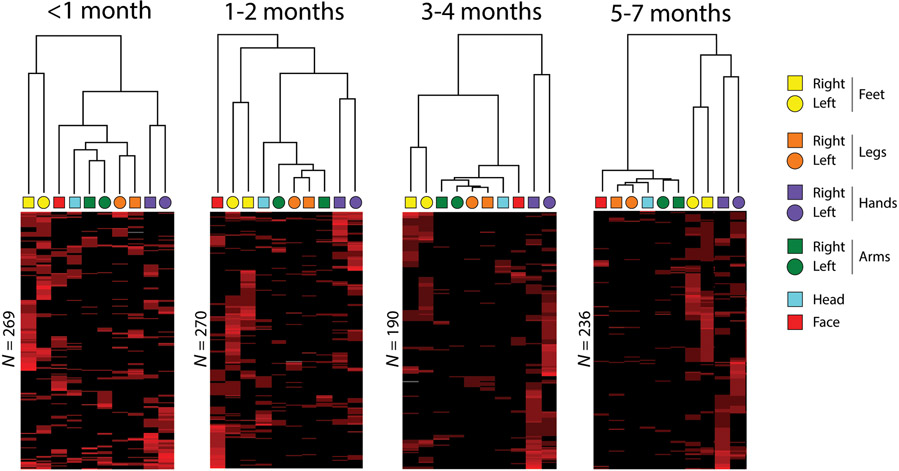
Figure 7.
Hierarchical cluster analyses, with seriation, of twitching pooled across four age groups. These analyses were performed on 10-s windowed “events” composed of bouts of twitches during sleep. Each 10-s event is represented as a row in the cluster diagram, with red corresponding to the presence of a twitch and black to its absence. The intensity of each red bar is proportional to the number of twitches in the associated body segment that occurred within that row (i.e., the same body segment could twitch multiple times within a 10-s window). Seriation of the rows reorders them such that events with similar patterns are placed closer together. Each infant contributed only once to the data within each pooled dataset. The number of rows for each age group is indicated.

