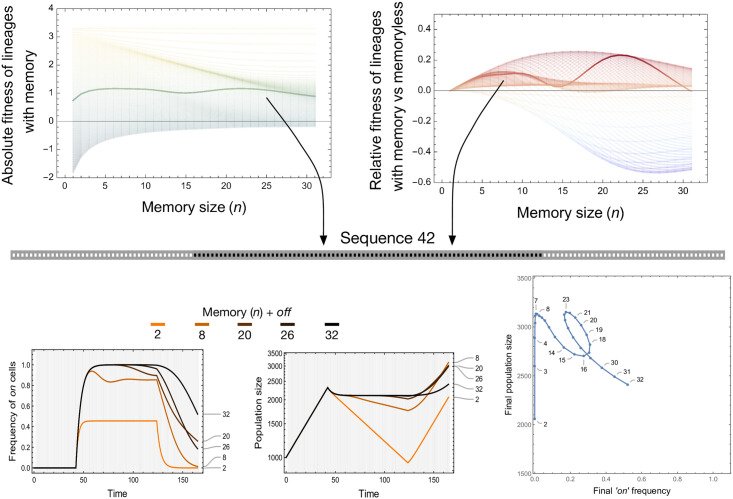
Fig 4. Lineage adaptation under treatment.
Top panels show the effect of memory size on absolute and relative lineage fitness. Each of the lines in the top panels corresponds to each of the 84 sequences from Fig 3. The colorscheme of the left and right top panels is the same as from Fig 3B and 3C with the 42nd sequence highlighted in bold. We report the frequency of ‘on’ cells and the population size in the bottom panels. The results are shown for a chosen number of memory sizes (n) + 1 (‘off’ compartment). The non-linear relationship between the final ‘on’ cell frequency and the final population size is shown in the last panel as n + 1 ranges from 2 to 32.

