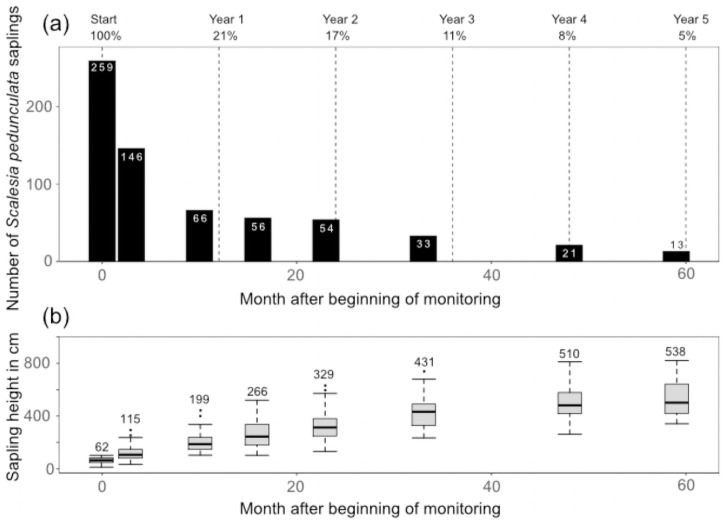
Fig 3.
(a) Number (within bars) and percent (top row) of surviving S. pedunculata saplings and young trees over 5 years. The mortality rate over five years was 95%. (b) Height of the S. pedunculata saplings and young trees over time. The boxplots display the median and the interquartile range (25th to 75th percentile), whiskers indicate the variability outside upper and lower quartiles and outliers are displayed. Mean height is given on top of the boxplots.

