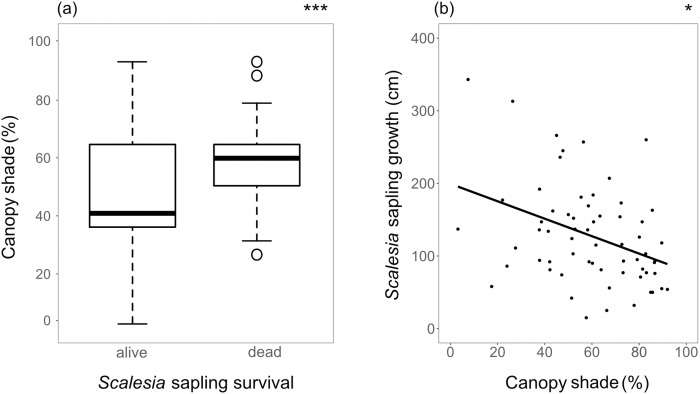
Fig 4. Percent canopy shade was significant in explaining S. pedunculata saplings mortality (a, GLM with binomial distribution and logit link function) and growth (b, GLM with a Gaussian distribution) after the first year.
Boxplots (a) display the median, interquartile range (25th to 75th percentile), variability outside upper and lower quartiles (whiskers) and outliers. Significance levels are reported as: [*] p < 0.05; [***] p < 0.001.

