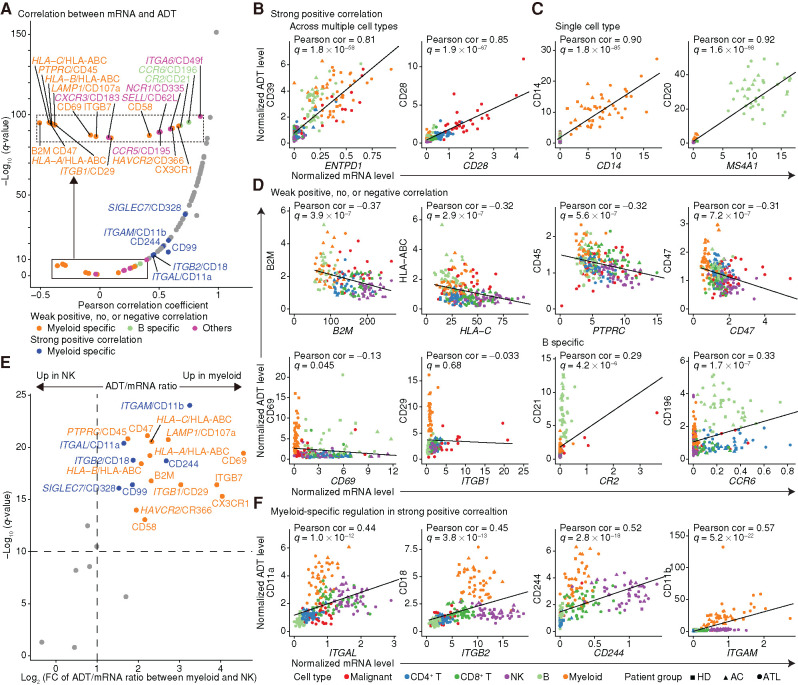
Figure 2.
Comparison of mRNA and ADT levels across cell types. A, Correlation coefficients and their significance for normalized mRNA and ADT levels. Genes with weak positive, no, or negative correlations (q ≥ 1 × 10⁻¹⁰) were depicted separately. Dots are colored if genes are under lineage-specific posttranscriptional regulation; otherwise, they are colored gray. The inset (dotted box) represents an enlarged view of the solid box. B–D, mRNA and ADT levels for representative genes showing a strong positive correlation across multiple cell types (B) and in a single cell type (C), and a weak positive, no, or negative correlation (D), with shapes and colors indicating patient group and cell type. E, Volcano plot comparing the ratio of ADT to mRNA levels between myeloid (NM08) and NK (NM05) cells. Fold change (FC) was calculated as the ADT/mRNA ratio in myeloid cells divided by that in NK cells when the average mRNA level was ≥0.2 in both cell types. ADTs with q < 10−10 and log2(FC) ≥ 1 were considered significant and colored by correlation significance. Mann–Whitney U test. F, mRNA and ADT levels of representative genes with dissociated ADT upregulation in myeloid cells. B–D and F, Each dot represents an average expression value for each cell type (≥30 cells) in each sample. Pearson correlation (cor) test with Benjamini–Hochberg correction. Fitted linear regression line is shown. See also Supplementary Fig. S2.

