Figure 3.
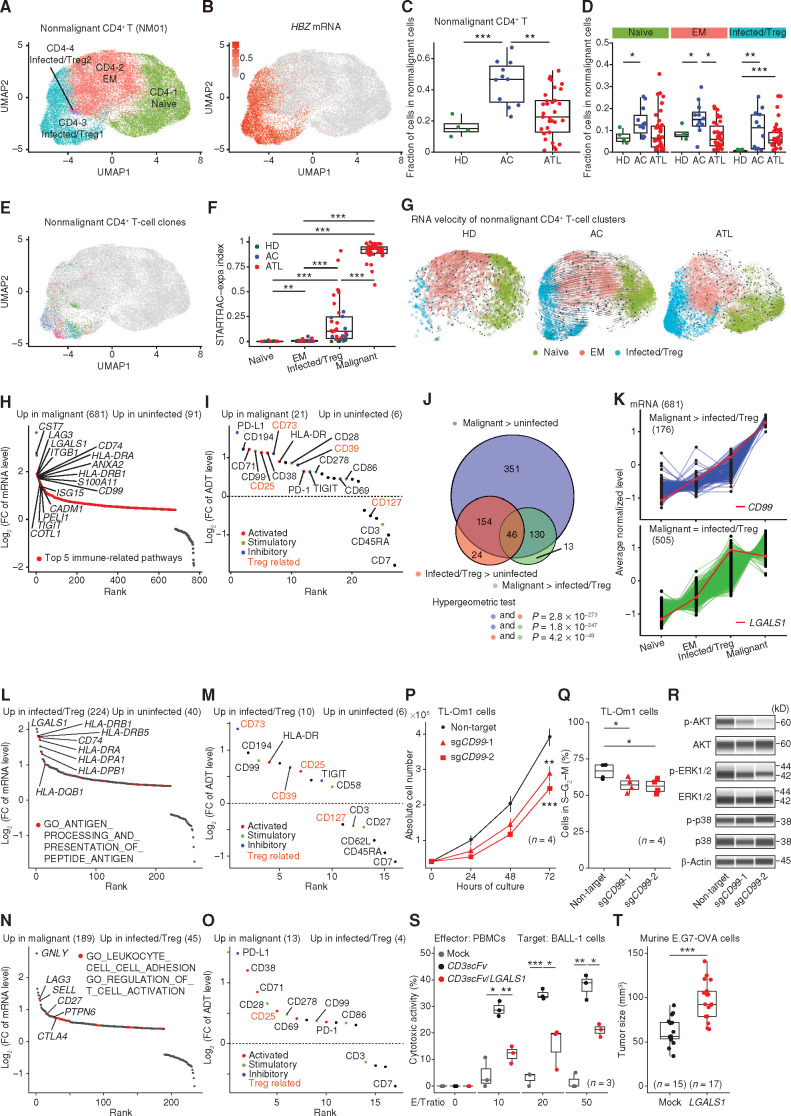
Cellular and molecular features of malignant and nonmalignant CD4+ T cells. A, Subclustering of nonmalignant CD4+ T cells (NM01). B, Normalized HBZ mRNA level (after ALRA imputation) on UMAP plots in A. C and D, The fraction of total nonmalignant CD4+ T cells (NM01; C) and naïve (CD4-1), EM (CD4-2), and infected/Treg (CD4-3 and -4) CD4+ T cells (D) in nonmalignant cells (NM01–08) for each sample. E, T-cell clones (present in ≥5 cells) on UMAP plots in A. Each color represents a distinct TCR clonotype. F, Clonal expansion levels of each CD4+ T cluster (≥30 cells) for each sample. G, Steady-state RNA velocity of nonmalignant CD4+ T clusters from HD, AC, and ATL samples. H and I, Differentially expressed mRNAs [q < 0.01 and log2(FC) > 0.4; H] and ADTs [q < 0.01 and log2(FC) > 0.3; I] between uninfected (CD4-1 and -2) and malignant (M01–30) clusters. FC, fold change. J, Overlap of upregulated mRNAs among comparisons between uninfected (CD4-1 and -2), infected/Treg (CD4-3 and -4), and malignant (M01–30) clusters. Hypergeometric test. K, Gene-expression patterns among CD4+ T clusters with higher (top) or comparable (bottom) mRNA levels in malignant (M01–30) compared with infected/Treg (CD4-3 and -4) clusters among those upregulated in malignant (M01–30) compared with uninfected (CD4-1 and -2) clusters. CD99 and LGALS1 are shown in red. L–O, Differentially expressed mRNAs (L and N) and ADTs (M and O) between uninfected (CD4-1 and -2) and infected/Treg (CD4-3 and -4; L and M) clusters and between infected/Treg (CD4-3 and -4) and malignant (M01–30; N and O) clusters. H, L, and N, Red color represents upregulated mRNAs related to indicated pathways. I, M, and O, Different colors represent different sets of T-cell–related ADTs. Treg-related ADTs are shown in orange. H, I, and K–O, Numbers of significant mRNAs or ADTs are shown in parentheses. P and Q, Growth curve (mean ± SD; P) and the frequency of cells in S–G2–M phase (Q) for TL-Om1 cells transduced with indicated single-guide RNAs (sgRNA; n = 4). R, Phospho (p)-AKT, AKT, p-ERK1/2, ERK1/2, p-p38, p38, and β-Actin (loading control) expressions for the same TL-Om1 cells. S, Cytotoxic activity of PBMCs (effector: E) against BALL-1 cells transduced with indicated plasmids (target: T) at various E/T ratios (n = 3). CD3scFV, anti-CD3 single-chain variable fragment. T, Tumor volume of mock- or LGALS1-transduced E.G7-OVA tumors at 6 days after transplantation (n = 15–17). C, D, F, P, Q, S, and T, Welch t test. ***, P < 0.0005; **, P < 0.005; *, P < 0.05. See also Supplementary Figs. S3 and S4.

