Figure 5.
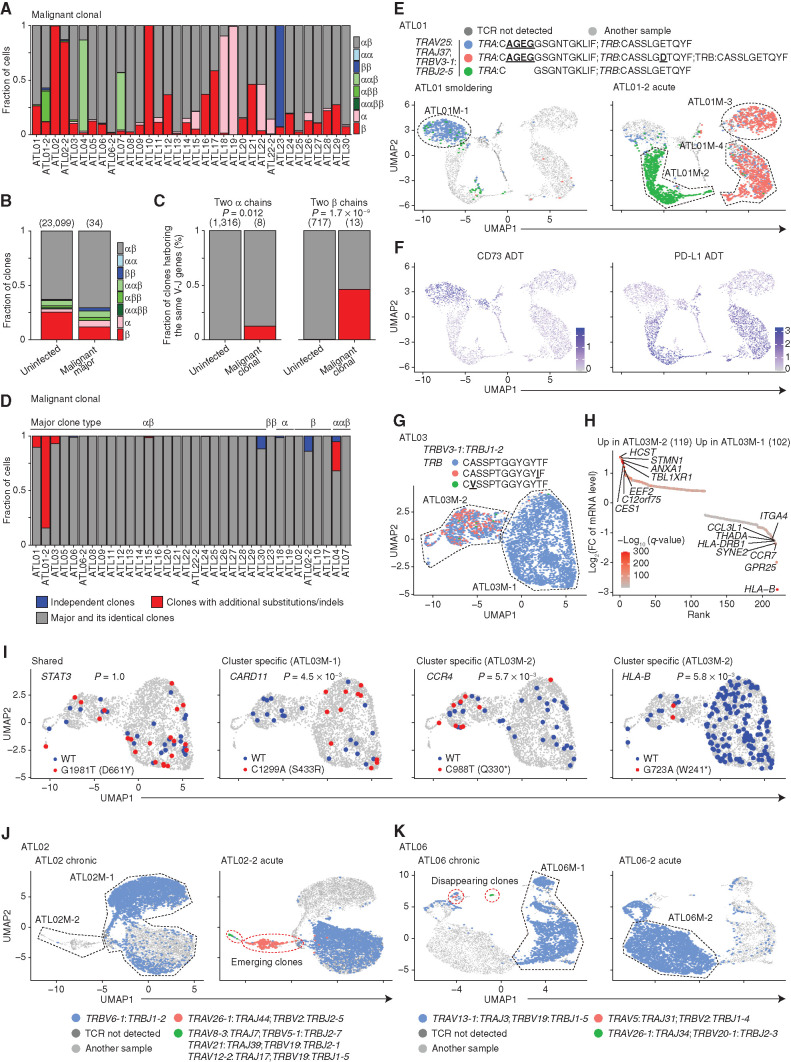
ATL clonal evolution revealed by scTCR-seq. A, The fraction of malignant clonal cells (≥5 cells) expressing different numbers of productive TCR α and β chains in each ATL sample. B, The fraction of clones expressing different numbers of productive TCR α and β chains in uninfected CD4+ T-cell and most expanded (= major) malignant clones. C, The fraction of clones harboring the same V-J gene pairs in uninfected CD4+ T and malignant cell clones expressing two productive α (left) or β (right) chains. B and C, Numbers of TCR clonotypes are shown in parentheses. D, The fraction of malignant clonal cells from major and its identical clones (gray), clones with additional substitutions/indels (red), or independent clones with different V-J pairs (blue) for each ATL sample. E and F, Distribution of expanded TCR clonotypes in ATL01 (left) and ATL01-2 (right; E) and normalized CD73 (left) and PD-L1 (right) ADT levels (F) on UMAP plots of malignant cells from both samples. G, Distribution of expanded TCR clonotypes on UMAP plot of ATL03 malignant cells. E and G, Underlined, bold text indicates CDR3 mutations. H, Differentially expressed mRNAs [q < 0.01 and log2(FC) > 0.4] between ATL03M-1 and ATL03M-2 malignant clusters. Red color gradient indicates q-value. FC, fold change. I, Somatic STAT3, CARD11, CCR4, and HLA-B mutations and their references on UMAP plots in G, detected by scRNA-seq data. Asterisk (*) indicates stop codon. WT, wild-type. C and I, Fisher exact test. J and K, Distribution of expanded TCR clonotypes in ATL02 (left) and ATL02-2 (right; J) and in ATL06 (left) and ATL06-2 (right; K) on UMAP plots of malignant cells from both samples of each patient. Red dotted lines surround clones emerging (J) or disappearing (K) after progression. E, G, J, and K, Black dotted lines surround subclusters. See also Supplementary Fig. S6.

