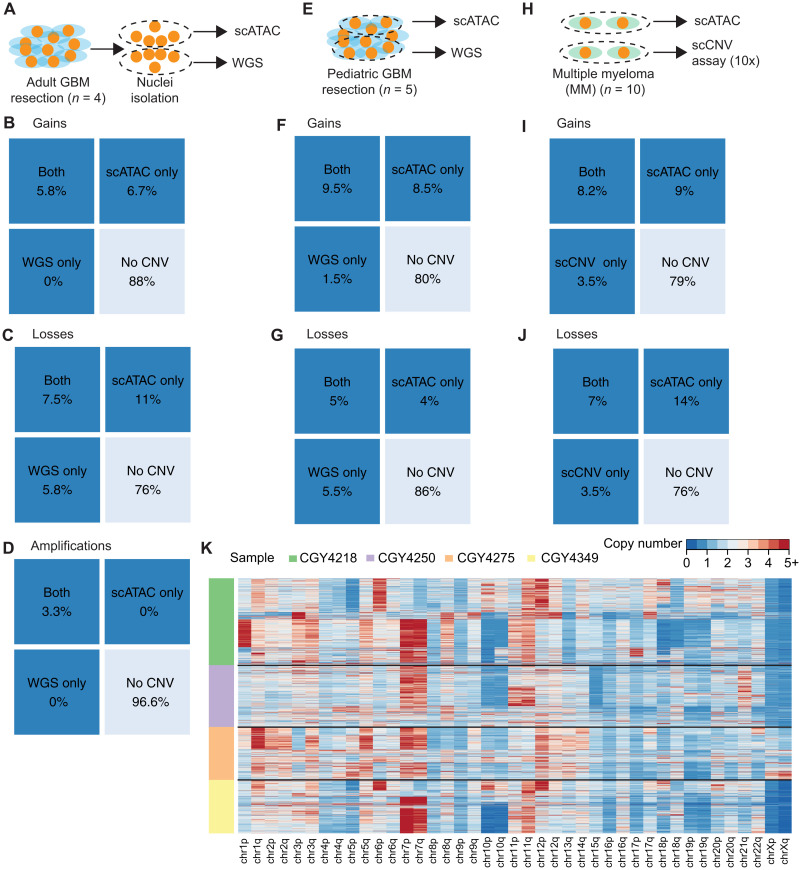
Fig. 2. Benchmarking of Copy-scAT with three methods involving clinical samples from three distinct malignancies.
(A) Banked cryopreseved aGBM samples were used for both scATAC and WGS. Nuclei were isolated from the samples, mixed, and used for both scATAC and WGS. (B to D) Percent of chromosome arm-level gains, chromosome arm-level losses, and focal amplifications detected in aGBM samples identified using both methods versus CNVs detected by scATAC or WGS alone. (E) Banked frozen pGBM samples were used for both scATAC and WGS. (F and G) Number of chromosome arm-level gains and losses detected in pGBM samples identified using both methods versus total numbers of gains detected by scATAC or WGS. (H) Fresh MM samples were used for both scATAC and 10x scCNV DNA analysis. (I and J) Number of chromosome arm-level gains and losses detected by both methods versus total numbers of gains detected by scATAC or 10x scCNV analysis. (K) Overview of raw transformed z-score profiles for four aGBM samples.

