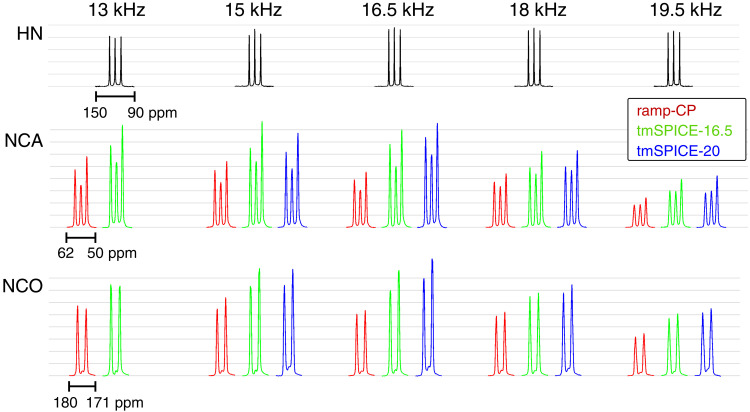
Fig. 6. Overview of f-MLF spectra acquired over a range of MAS frequencies.
(Top) 15N ramp-CP (linear rf ramp 70 to 100% on 1H channel) spectra of approximately equal intensity over the whole range of MAS rates. (Middle and Bottom) 13C spectra of the Cα and C′ spectral region, respectively, acquired using NCA and NCO experiments with 1H-15N and 15N-13C magnetization transfers. While the 1H-15N step was carried out using the same pulse sequence element, ramp-CP (linear rf ramp 90 to 100% on 13C channel), tm-SPICE-16.5, and tm-SPICE-20 schemes were used for the 15N-13C step, resulting in spectra plotted in red, green, and blue, respectively. The optimal control tm-SPICE set of pulses consistently yields the highest signal intensity, which is about 1.5 times the intensity of the ramp-CP experiments. All NCA and NCO spectra are displayed with a common scale on the y axis, with gray grid lines facilitating visual comparison.

