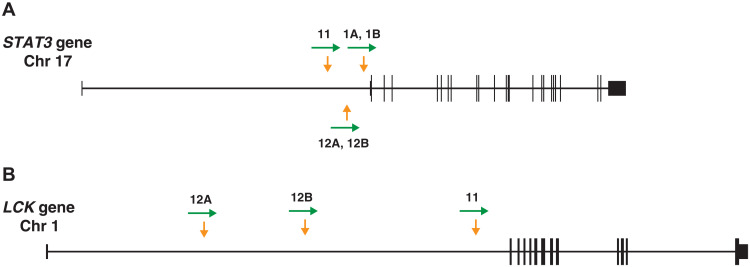
Fig. 4. Integration sites in the T cell lymphomas from donors 1 (samples 1A and 1B), 11, and 12 (samples 12A and 12B).
(A) Map of the STAT3 gene, derived from the hg19 version of the human genome using the UCSC browser. The vertical arrows (yellow) show the sites of HIV integration in the genomic DNA extracted from the lymphomas. The horizontal arrows (green) show the orientation of the HIV-1 provirus. The exons are shown as boxes; the coding regions are shown as taller boxes than the noncoding regions. (B) Similar to (A), showing the integration sites in the LCK gene.

