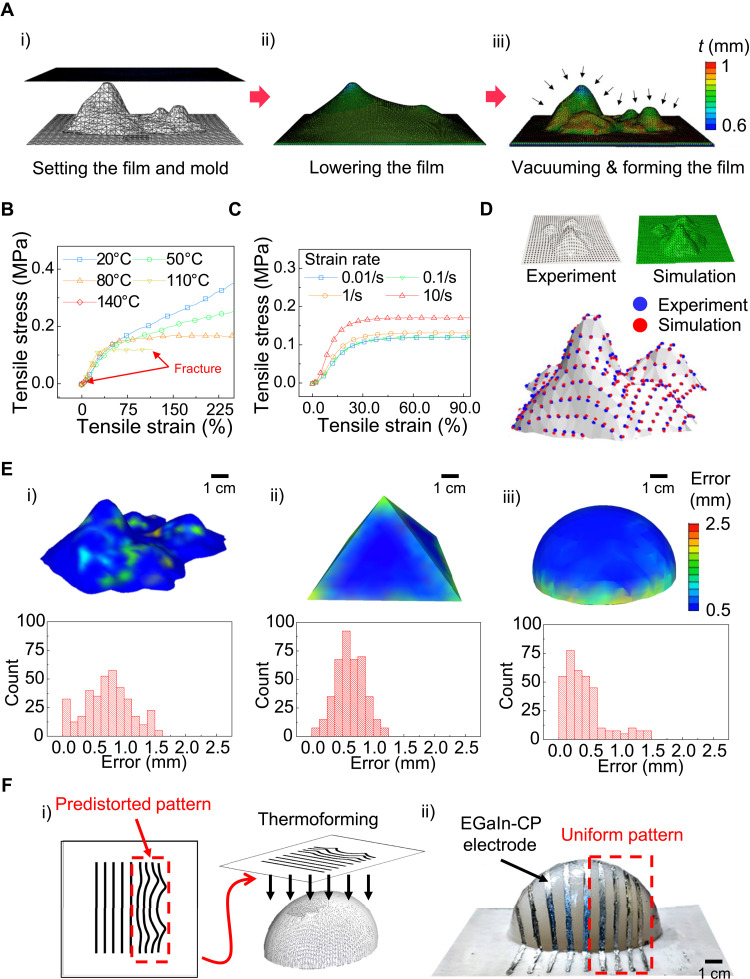
Fig. 3. Numerical and experimental analysis of thermoforming process.
(A) Thermoforming simulation process. (i) The 3D mold mesh is placed on the bottom plate, and the 2D planar mesh is placed above the 3D mold mesh. (ii) The 2D planar mesh is lowered. (iii) Vacuum pressure is applied to the 2D planar mesh that is pulled toward the 3D mold mesh. (B) Stress-strain curves of the SEBS film at different temperatures (at a strain rate of 1/s). (C) Stress-strain curves of the SEBS film at different strain rates (at a temperature of 110°C). (D) Comparison between the simulated results and the experimental results. There is high similarity between the simulation result and the 3D reconstruction of the experimental result. (E) Visualization of distance errors between the 3D reconstruction and the simulated results using 3D color map and histograms for various shapes: mountain (i), pyramid (ii), and parabola (iii). (F) 3D line patterning of EGaIn-CP electrodes. (i) Predistorted pattern generation and thermoforming. (ii) Fabricated result. On the right side, uniform 3D line patterns with similar dimensions could be obtained with the predistorted pattern compared to pristine patterns on the left side. Photo credit: Jungrak Choi, KAIST.

