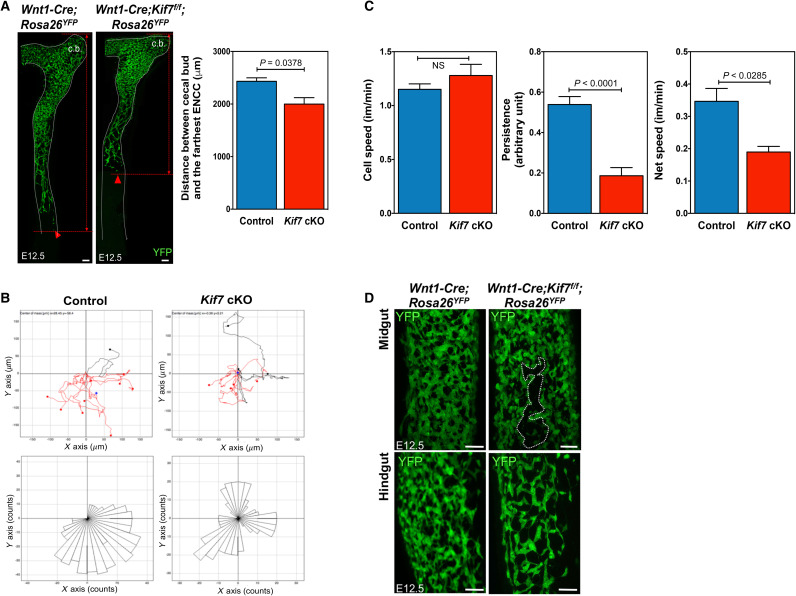
Fig. 3. Defects in migration and gut colonization in Kif7 mutants.
(A) Whole-mount images of E12.5 control (Wnt1-Cre;Rosa26YFP) and Kif7 mutant (Wnt1-Cre;Kif7f/f;Rosa26YFP) guts; ENCCs were YFP+. The distance from the cecal bud (c.b.) to the furthest ENCC (as indicated by the arrows) in control and mutant guts was measured and is shown in the bar chart. (B) Top: Chemotaxis plot from time-lapse movies of the hindgut of E12.5 control and Kif7 cKO. Ten and seven tracks were counted in control and Kif7 cKO samples, respectively. The migratory tracks of cells moving upward and downward relative to the center of mass (blue cross) are shown in red and black, respectively. Bottom: Polar histograms representing the trajectories of the most caudal cell at 5-min intervals in three explants of E12.5 hindgut. (C) Cell speed of ENCCs at the migratory wave front, persistence, and net speed are presented in the bar charts. (D) Whole-mount immunostaining with GFP antibody was performed on E12.5 control and Kif7 cKO guts. The uncolonized region is marked by a dashed line.

