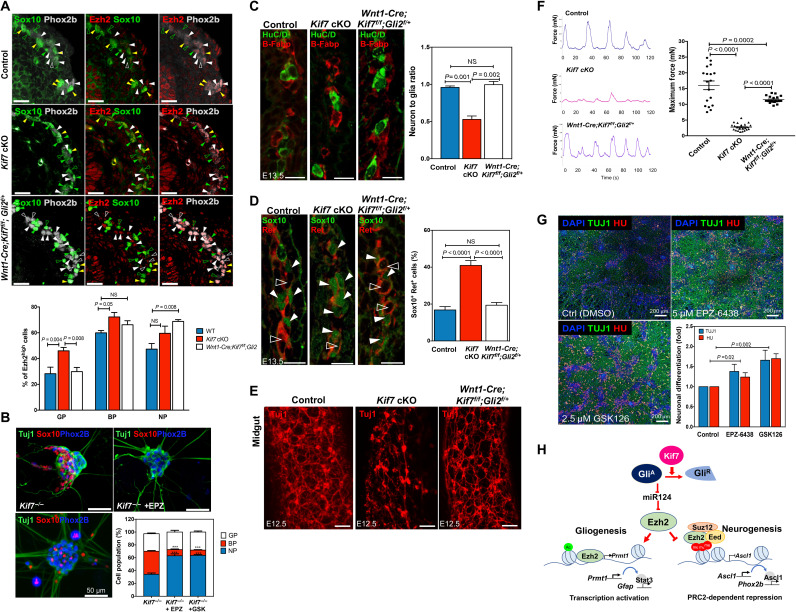
Fig. 8. Kif7-Gli2-Ezh2 mediates the differentiation of mouse and human ENCCs.
(A) Ezh2 expression in various ENS progenitor pools in E13.5 control and mutant guts. GP, Ezh2high/Sox10+/Phox2b− (green filled arrowheads); BP, Ezh2high/Sox10+/Phox2b+ (yellow filled arrowheads); NP, Ezh2high/Sox10−/Phox2b+ (white filled arrowheads). Cells with low expression level of Ezh2 are marked with open arrowheads. Bar chart shows the percentages of Ezh2high cells in different ENS progenitor pools (n = 6; scale bars, 50 μm). (B) In vitro differentiation assay with Kif7−/− ENCCs treated with GDNF alone or in combination with either EPZ-6438 or GSK126 for 10 days. Sox10+/Phox2b+, Phox2b+Sox10−, Sox10+/Phox2b−, and Tuj1+ cells represent BP, NP, GP, and committed neurons, respectively. Bar chart shows mean ± SEM (n = 3). (C) Neuronal (HuC/D+) and glial (B-Fabp+) cells, (D) progenitors (Ret+ Sox10+, filled arrowheads), and neuronal precursors (Ret+ Sox10−, open arrowheads) in E13.5 control and mutant guts were detected using immunohistochemistry. The neuron-to-glia ratios and the percentages of Sox10+ Ret+ cells over the sum of Ret+ and Sox10+ cells are shown in the bar charts (n = 6; scale bars, 25 μm). (E) Whole-mount immunostaining with Tuj1 antibody. Scale bars, 100 μm. (F) Gut motility assay with the distal colon of control and mutants. Dot plot shows the maximum contraction force detected in the control and mutants (n = 6). (G) hENCCs were cultured in neuronal differentiation for 5 days in the absence or presence of Ezh2 inhibitor (GSK126, 2.5 μM or EPZ-6438, 5 μM). The differentiation capacities of hENCCs were monitored on the basis of the expressions of TUJ1/HU, as revealed by immunocytochemistry. Bar charts show mean ± SEM (n = 3). (H) Schematic shows the regulatory network of Kif7-Gli2-miR124-Ezh2 underlying the neurogenic and gliogenic lineage differentiation.

