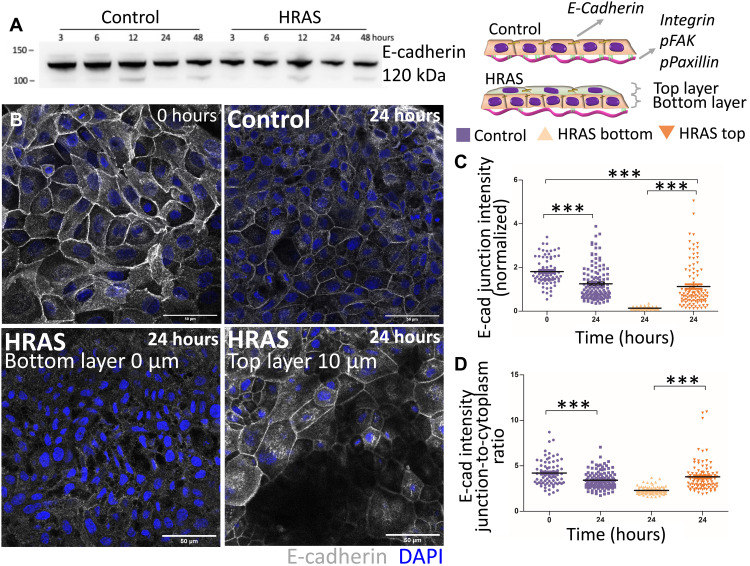
Fig. 4. Oncogenic HRAS expression alters the expression of E-cadherin.
(A) Western blot showing E-cadherin expression in nontransformed (control) and HRAS-transformed MCF10A cells over 48 hours from oncogene induction. (B) Representative confocal images showing the distribution of E-cadherin at t = 0 hours and within nontransformed and HRAS-transformed tissues at t = 24 hours. E-cadherin is labeled in gray, nuclei are labeled in blue. Scale bars, 50 μm. (C and D) Global E-cadherin fluorescence intensity in non-transformed (control) and HRAS-transformed epithelia: (C) junctional intensity (normalized) and (D) ratio of junctional to cytoplasmic intensity. Means ± SEM of median values from at least three individual patterns and Kruskal-Wallis statistic test with Dunn’s multiple comparison test, ***P < 0.001.

