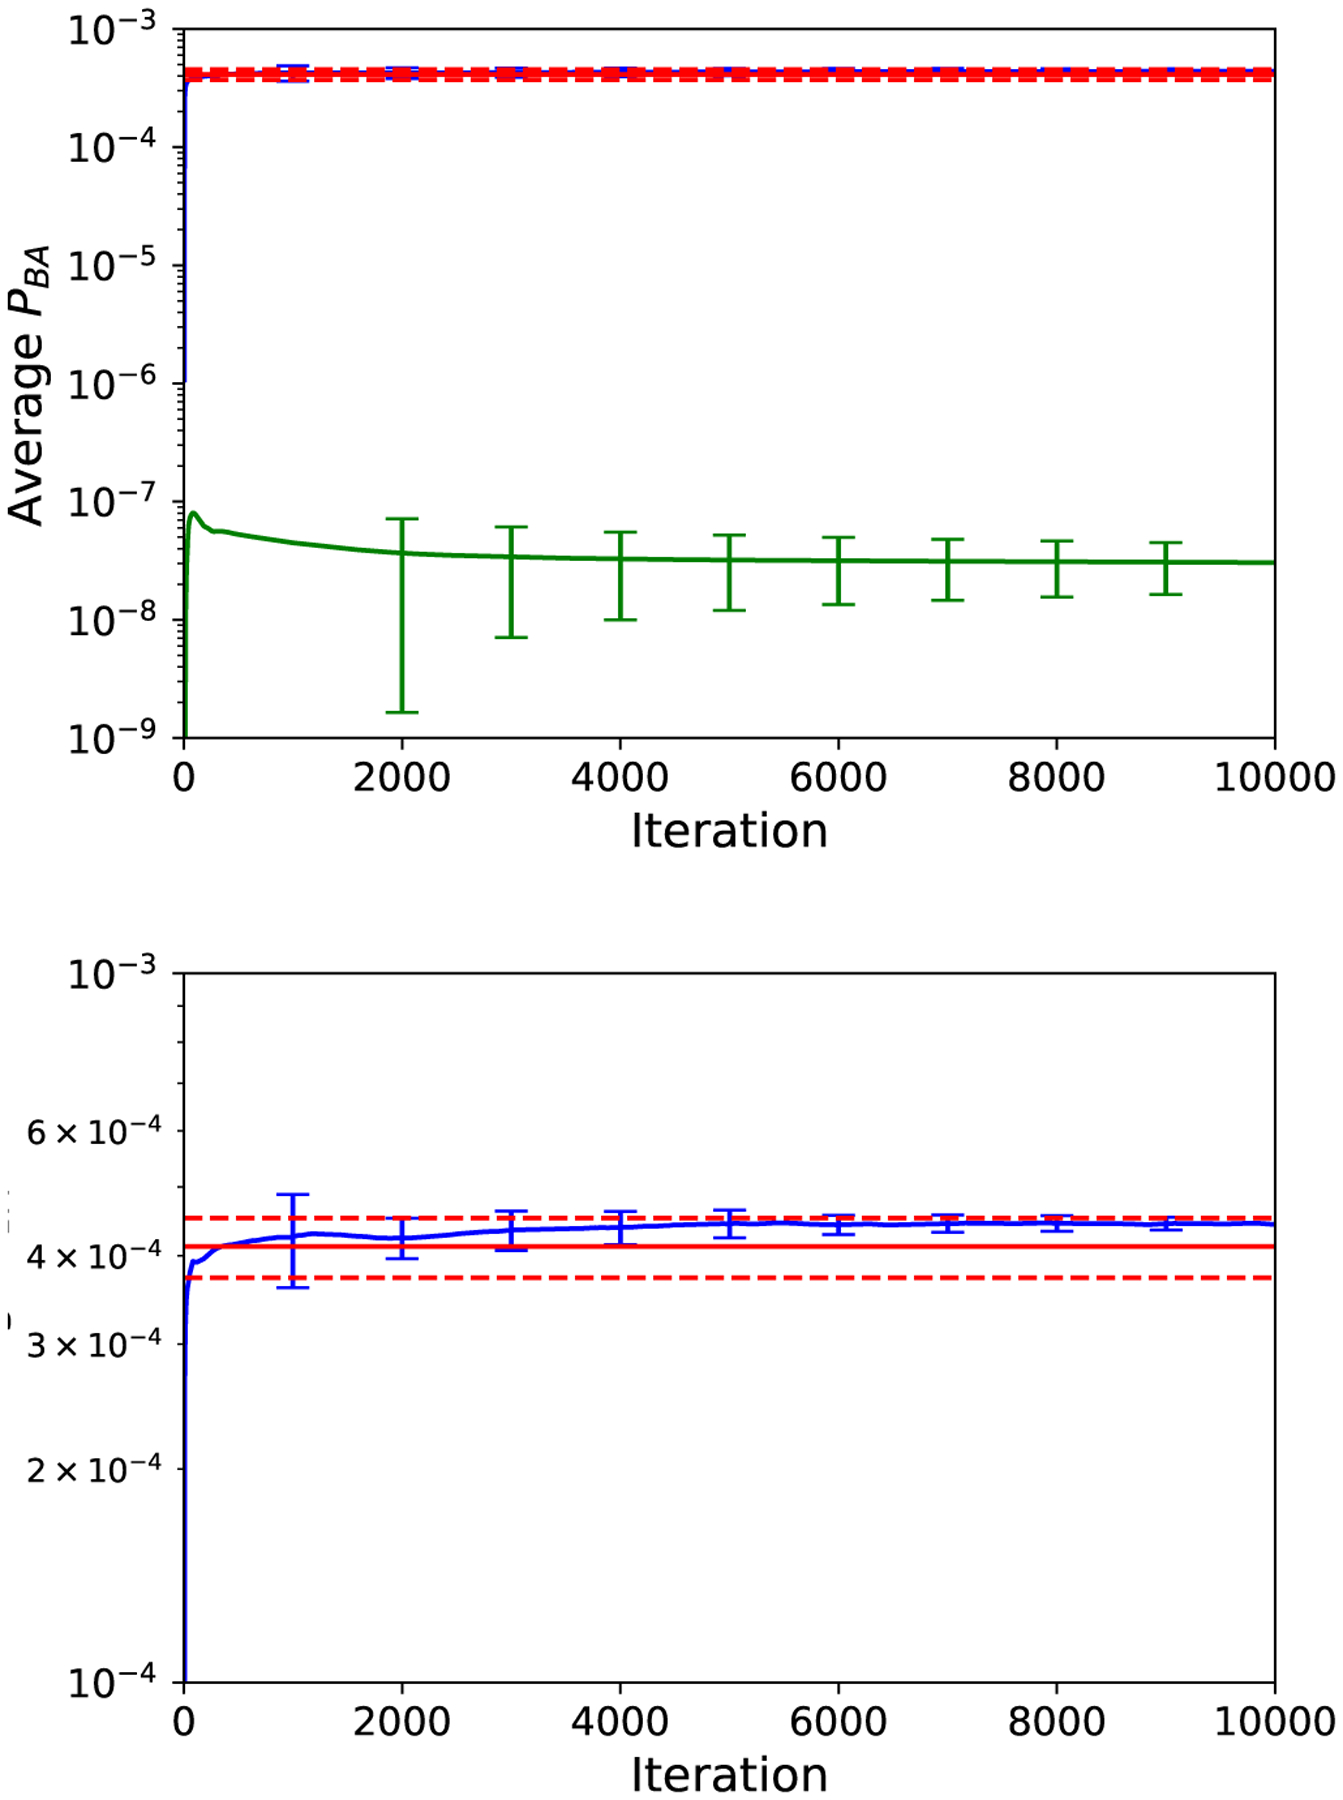
FIG. 3.

Running estimate of PBA from NEUS for dynamics starting at ϕ = −58.0° (blue, upper curve; error bars are computed every 1000 iterations and indicate where s is the standard error estimated from n = 10 independent NEUS simulations) compared to the final result from direct simulation (red solid line; dashed lines indicate , where n = 106 is the number of physically weighted trajectories generated and p is the estimate of PBA from the direct simulation). Also shown is the estimate from NEUS for dynamics starting from ϕ = −91.0° (green, lower curve; error bars computed similarly as the blue curve). The estimate at each iteration is computed as the average of the previous 1000 iterations. Lower panel is a magnification of the upper panel.
