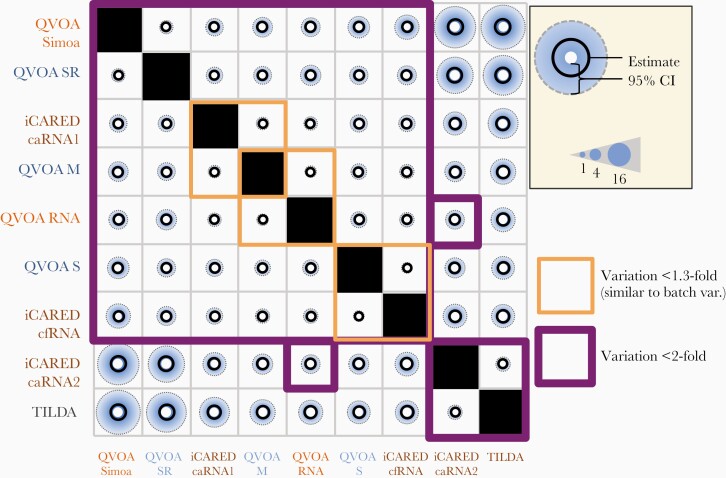
Figure 3.
Between-assay random effect (fold variation in infectious units per million [IUPM] values). Comparison of extra-Poisson variation in split samples tested by different assays. Purple boxes indicate pairs of assays with <2-fold excess random variation; orange boxes, pairs with <1.3-fold excess variation; black circles, median estimates; blue shaded areas, upper limit of credible interval; and size of white center, lower limit of credible interval. One-fold variation is the minimum possible, corresponding to no excess variation after correction for any systematic scale effects (Figure 2). The fold variation in IUPM values is the result of exponentiating the standard deviation of the random effect modeled on the natural log scale. Abbreviations: caRNA1, cell-associated human immunodeficiency virus (HIV) gag RNA; caRNA2, cell-associated HIV tat-rev RNA; cfRNA, cell-free HIV RNA; iCARED, inducible cell-associated RNA expression in dilution; QVOA, quantitative viral outgrowth assay; QVOA M, QVOA by University of Pittsburgh; QVOA RNA, QVOA by University of California, San Diego, with HIV RNA readout; QVOA S, QVOA by Johns Hopkins University; QVOA Simoa, QVOA by Southern Research using Simoa readout; QVOA SR, QVOA by Southern Research; TILDA, tat/rev-induced limiting dilution assay.

