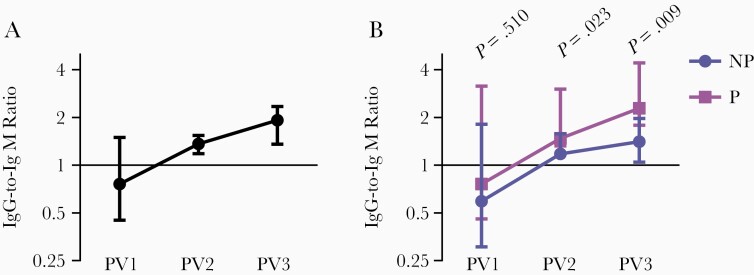
Figure 4.
Ratio of IgG to IgM after each RTS,S dose. Serum from adults vaccinated with RTS,S collected PV1 (n = 45), PV2 (n = 43), and PV3 (n = 33) were tested for IgG and IgM to full-length CSP. The ratio of IgG to IgM was calculated at each time point, and the group median and 95% CI of the median were graphed. A, All participants and (B) those who were not protected (NP, n = 17) and protected (P, n = 16) against controlled human malaria infection are shown. The ratio of IgG to IgM (for NP and P groups) at all time points was compared using Mann-Whitney U test. Abbreviations: CI, confidence interval; CSP, circumsporozoite protein; IgG, immunoglobulin G; IgM, immunoglobulin M; PV1, post vaccine dose 1; PV2, post vaccine dose 2; PV3, post vaccine dose 3.

