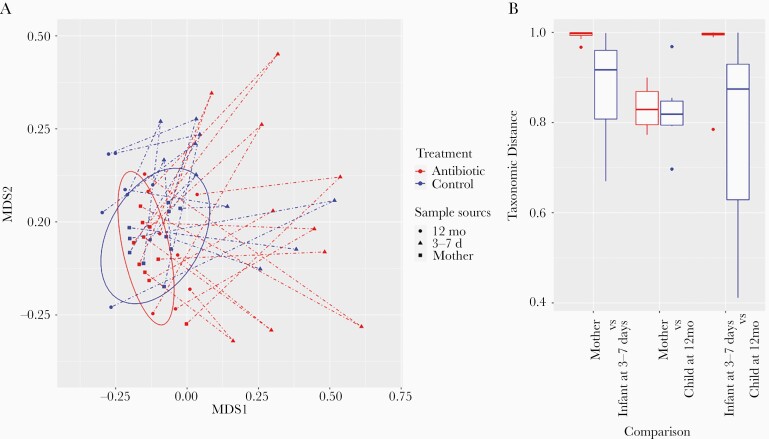
Figure 5.
Nonmetric multidimensional scaling (MDS) plot of samples and taxonomic distance between groups. A, X-axis and y-axis are the two MDS dimensions. Each point is a sample. A dashed line connects a mother’s sample to an infant’s sample at 3–7 days after birth, then to that child’s sample at 12 months. The 2 overlapping ellipses cover the mothers’ samples in the control and the antibiotic-treated groups. B, Taxonomic distance (range, 0.0–1.0) between different groups. Both plots were based on Bray-Curtis distance on species relative abundance.

