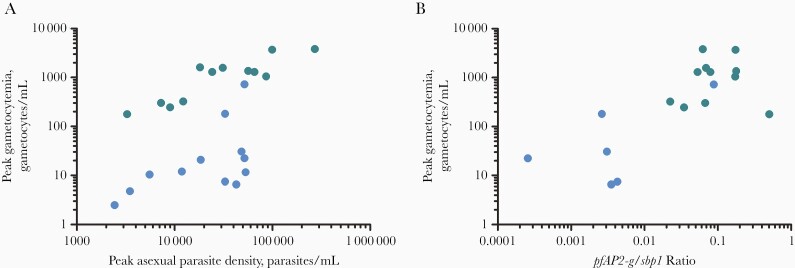
Figure 3.
Association between asexual parasite density, transcripts indicative of sexual commitment, and subsequent gametocyte density. Blue dots represent data from mosquito bite inoculation; green dots, data from blood-stage inoculation. A, Correlation between peak asexual parasitemia and peak gametocytemia after mosquito bite (n = 12) (Spearman ρ = 0.64; P = .02); or blood-stage inoculation (n = 12) (ρ 0.77; P = .003). B, Correlation between peak gametocytemia and the ratio of pfap2-g transcripts to ring-stage asexual sbp1 transcripts (n = 17) (Spearman ρ = 0.66; P = .001).

