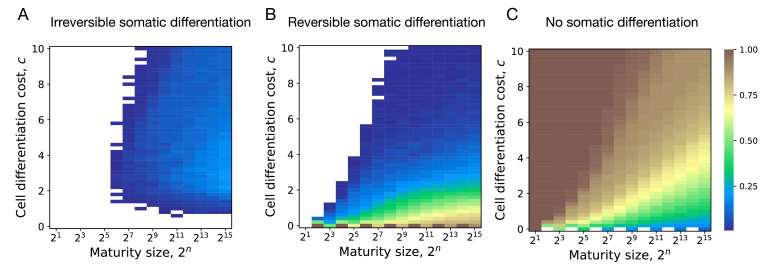
Appendix 3—figure 1. Impact of maturity size on the evolution of development strategies.
The fractions of 200 random composition effect profiles promoting irreversible (A), reversible (B), and no differentiation (C) strategies at various cell differentiation costs () and maturity size . Irreversible strategies are most abundant at large maturity sizes and intermediary cell differentiation costs. Reversible strategies are most abundant at small cell differentiation costs. No differentiation strategies are most abundant at small maturity sizes and cell differentiation costs. The legend is the same as that in Figure 2A–C.

