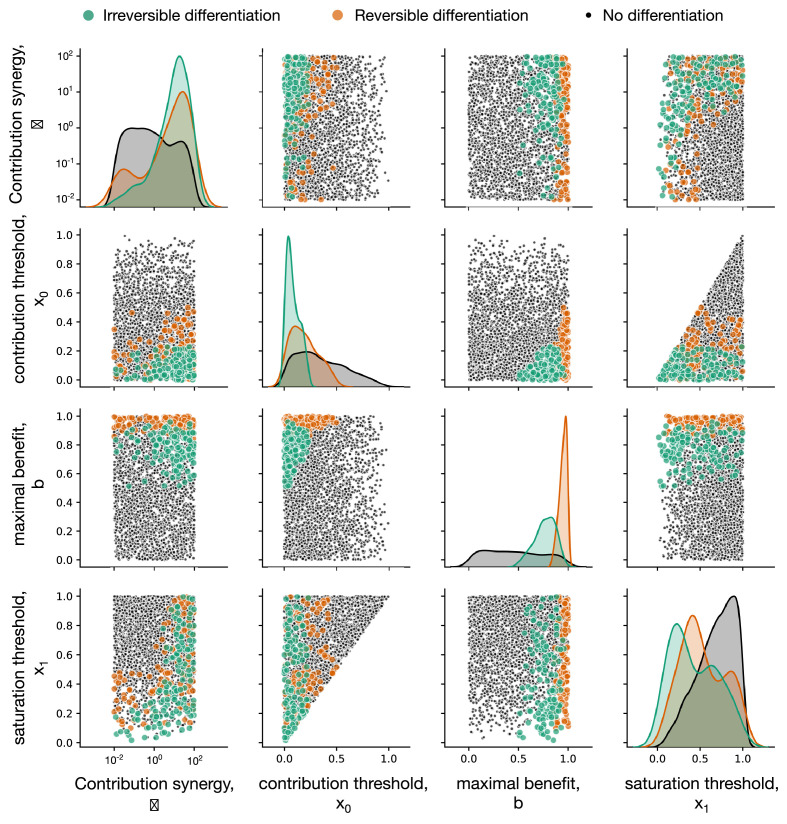
Appendix 4—figure 1. Impact of composition effect parameters on the evolution of development strategies.
Each diagonal panel represents individual distribution of each of four parameters among composition effect profiles promoting irreversible (green), reversible (orange), and no differentiation (black) strategies. Each non-diagonal panel represents a pairwise co-distribution of these parameters. Irreversible (green) strategies are promoted at small contribution thresholds and intermediary maximal benefit . Also, either the contribution synergy must be large, or the saturation threshold should be small – see main text for detailed discussion. Reversible (orange) strategies require large – there the benefits of having a large number of soma-role cells outweighs costs paid by frequent differentiation. Due to the fast accumulation of soma-role cells, reversible strategies tolerate larger than irreversible. Reversible exhibit the same restrictions with respect to as irreversible and are insensitive to . For this figure, 3000 composition effect profiles were investigated with costs and .

