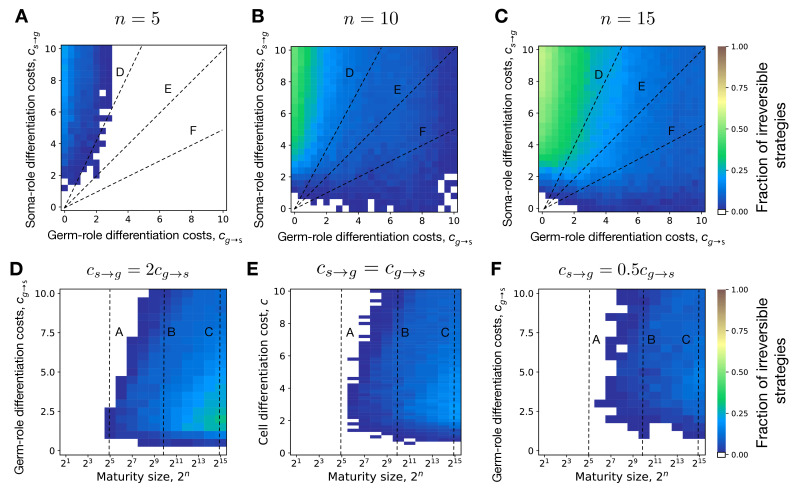
Appendix 5—figure 1. Evolution of irreversible somatic differentiation at unequal cell differentiation costs.
(A-C) The fraction of 200 random composition effect profiles promoting irreversible strategy at various cell differentiation costs (, ) at fixed maturity size (panel A), 10 (B), and 15 (C). Larger maturity sizes promote the evolution of irreversible differentiation across all cell differentiation costs. (D-F) The fraction of composition effect profiles promoting irreversible strategy at unequal cell differentiation costs (panel D), (E), and (F). Even with unequal differentiation costs, the minimal maturity size allowing the evolution of irreversible differentiation stays roughly the same — cells. Dashed lines indicate overlap between panels. The legend is the same as that in Figure 2A–C.

