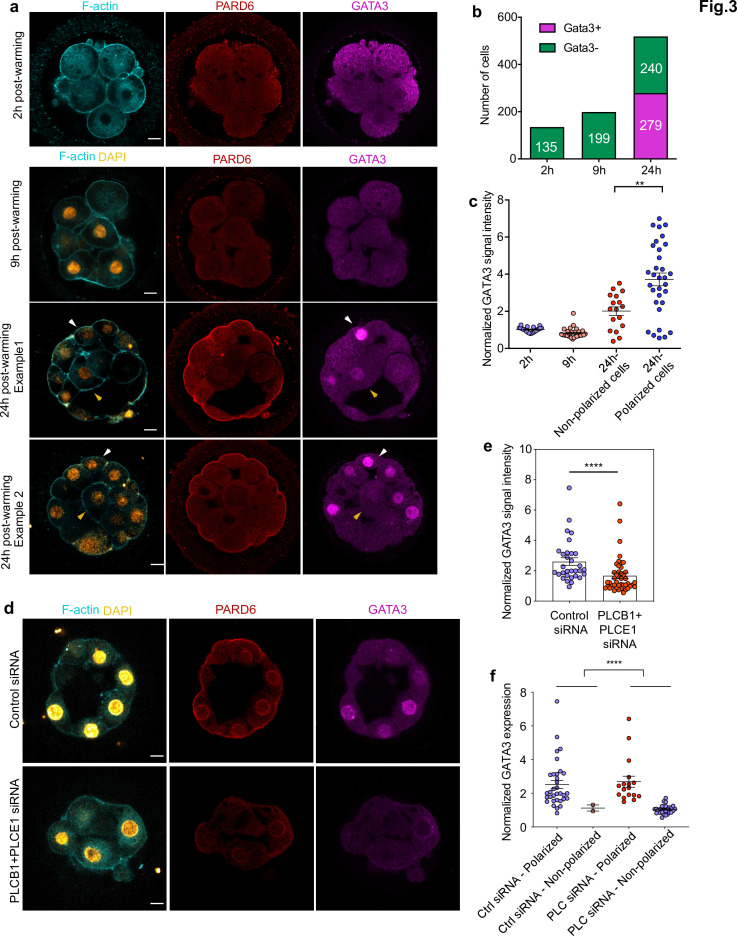
Figure 3. GATA3 expression is initiated independently of cell polarization.
(a) Representative images of in vitro fertilized human embryos warmed at day 3 and cultured for 2, 9, or 24 hr (see scheme in Figure 1a ) to reveal the localization of F-actin, PARD6, and GATA3. White arrowheads indicate outer cells; yellow arrowheads indicate inner cells. (b) Quantification of the number of GATA3-positive cells in embryos from panel a. Cells that have higher nuclear GATA3 signal (above a nucleus to cytoplasm ratio of 1.5) are categorized as GATA3+ cells. Numbers in each bar indicate the number of cells analyzed. ns, not significant, Fisher’s exact test. N = 17 embryos for 2 hr N = 20 embryos for 9 hr and N = 33 embryos for 24 hr. (c) Quantification of GATA3 nuclear signal in embryos from panel a. Each dot represents one cell. Data are shown as mean ± S.E.M. The GATA3 nuclear signal has been calculated as the nucleus to cytoplasmic signal ratio in each cell. N = 21 cells (2 hr), N = 32 cells (9 hr), and N = 49 cells (24 hr). **p < 0.01; two-tailed unpaired Student’s t-test. (d) Representative images of embryos injected with Control siRNA or PLCB1+ PLCE1 siRNA at the zygote stage, cultured until Day 4, and stained for F-actin, PARD6, and GATA3. (e), Quantification of GATA3 nuclear signal intensity (normalized against the cytoplasmic signal) in embryos from panel d. Each dot indicates one cell analyzed. N = 31 cells for Control siRNA group and N = 44 cells for PLCB1+ PLCE1 siRNA group. ****p < 0.0001, Mann-Whitney test. Five independent experiments (a–c) and two independent experiments (d-f). Scale bars, 15 µm. (f), Quantification of the level of nuclear GATA3 (normalized against cytoplasm signal) in embryos injected with Control siRNA or PLCB1+ PLCE1 siRNA. The data were classified according to the polarity status of the cells. Each dot indicates one cell. N = 31 cells for Control siRNA and N = 44 cells for PLCB1+ PLCE1 siRNA, ****p < 0.0001, Mann-Whitney test.


