. 2021 Sep 30;10:e73062. doi: 10.7554/eLife.73062

Figure 3. The size distribution of extracellular vesicles (EVs) secreted by astrocytes is altered in the LRRK2 G2019S mutant.

(A) Transmission electron microscopy (TEM) images demonstrate that induced pluripotent stem cell (iPSC)-derived astrocytes actively produce and secrete EVs by exocytosis. The dashed line delineates the plasma membrane. The white arrows indicate EVs. (B) Overview of the procedure to isolate EVs by ultracentrifugation. ACM: astrocyte conditioned medium; Cryo-EM: cryogenic electron microscopy. (C) Nanoparticle tracking analysis (NTA) quantification of the number of particles (i.e., EVs) isolated in WT or LRRK2 G2019S ACM by ultracentrifugation as described in (B). (D) Graph showing the distribution of isolated EVs by particle size. Data in (C, D) are from two independent biological replicates; error bars represent mean + SEM. Statistical analysis was performed using two-tailed unpaired Student’s t-test with equal s.d. (ns: not significant). (E–G) Secreted EVs were imaged by cryo-EM (E) and their diameter (F) and morphology (G) was analyzed. Data are from ≥177 EVs isolated from ACM taken from 30.4 × 10⁶ plated astrocytes for each experimental condition; error bars are mean + SEM for three independent biological replicates. Statistical analysis was performed using two-tailed unpaired Student’s t-test with equal s.d. (*p≤0.05).

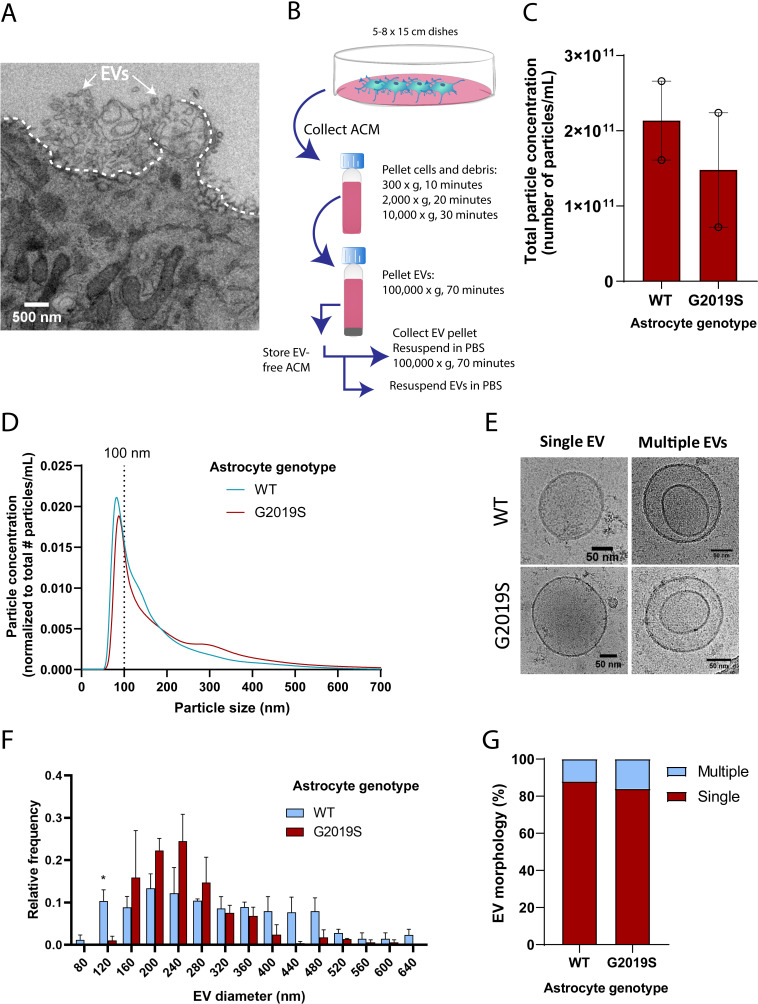
Figure 3.

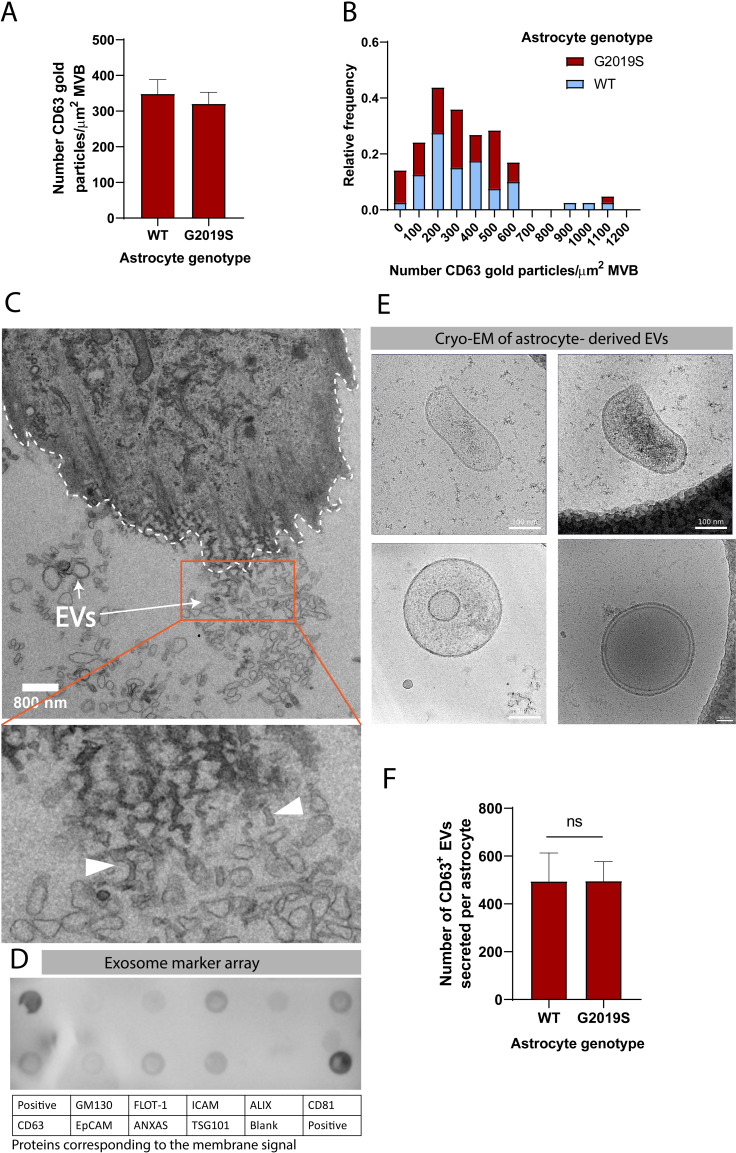
Figure 3—figure supplement 1. Analysis of astrocyte-secreted extracellular vesicles (EVs).

Figure 3—figure supplement 1.

(A, B) Quantification of CD63 gold particles shown as the number of particles per µm2 multivesicular body (MVB) (A) and relative frequency (B) in WT vs. LRRK2 G2019S astrocytes. Error bars represent mean + SEM. (C) Transmission electron microscopy (TEM) image of an astrocyte and astrocyte-secreted EVs. The dashed line indicates the astrocyte cell membrane, and the arrows indicate EVs. The red box and the zoomed-in view show EVs that appear to bud from the astrocyte membrane (white arrowheads). (D) Identification of exosome markers in EV-enriched fractions obtained from astrocyte conditioned media (ACM) using an exosome antibody array. Each circle on the membrane represents a preprinted antibody spot marker of exosome or cellular contaminant, and the table details the name of each antibody marker spotted on the membrane. (E) Cryo-electron microscopy (cryo-EM) images of astrocyte-derived EVs that display an unusual morphology. (F) Quantification of the number of CD63+ EVs secreted in WT and LRRK2 G2019S ACM by ELISA using ELISA standards calibrated by nanoparticle tracking analysis (NTA) as discussed in Materials and methods. Data are from at least three independent biological replicates; error bars represent mean + SEM. Statistical analysis was performed using two-tailed unpaired Student’s t-test with equal s.d.